
Leadership in Biotech

Author: Kristin Gleitsman Page 6 of 7

Scientist. Research and Development Leader. Collaborative Problem Solver.
Passionate about building belonging, so that together we can accomplish important, hard things.

Budgeting 101: Using our newly acquired financial intelligence to make sense of the budgeting process

We interrupt our regularly scheduled programming to talk about… budgeting.

It’s budget season as we head into the fourth quarter of the year, a process which has been equal parts mystifying and demoralizing for me in the past. But there’s hope! With a little bit of financial intelligence under our belts, we science-folk can start to make sense of how this process works.

Let’s take a step back and write out a functional definition of budgeting: What you can afford in the current market conditions given the strategic direction of the business. (credit to my friend Bill King for this one)

Let’s pull that definition apart.

What you can afford depends on your revenue projections and financing— we’ll talk about that a bit more below.

The current market conditions take into account things like interest rate and overall economic climate (we’ll talk a lot about how these factors impact how companies think about internal and external investments later in our series where we discuss ways of evaluating return on investment and something called Net Present Value).

And the strategic direction of the business includes factors like: is this a start-up? Are you positioning your company for sale or scale? Is this business a nice cash cow, but you don’t care much about growth? These factors speak to the phase a company is at as well as the mindset of the leadership/owners. As you will see below, this perspective becomes central to how incremental budget dollars are allocated.

Where to start? Well, before you can set a budget, you need to be able to approximate what growth trajectory your business is on.

Step 1: Revenue projections

So step 1 is to answer the question: what are your revenue projections for the coming year?

For the purposes of illustration, let’s imagine it’s 2021 and we are working on the 2022  budget for our exemplar company, BioTechne.

Screenshot of a budget summary from the BioTechne

Of course, knowing what happened in 2022 is quite handy here, so we can project with absolute confidence something like 20% top line growth in 2022. While it’s good to know the future for the sake of our example, of course normally you’d be forecasting based on past trends and current information about the market and business you are in.

Step 2: Gross margin percentage

Step 2 is to calculate the gross margin percent. In this case, it is a pretty consistent ~68%. Now if you knew you had a major product improvement aimed at improving margin in the coming year, you probably want to take that into account, but here the past was a pretty good predictor of the future, so using the 2021 gross margin percent was pretty spot on for what happened in 2022.

Step 3: Calculate incremental budget

Step 3 is to calculate your total incremental budget. This formula is the Revenue Projection for the coming year minus the revenue for this year, times the gross margin percentage. Here we have the benefit of omniscience, so we can calculate (1,105,599-931,032)*68% =  118,706 as our incremental budget.

Step 4: Allocation

Step 4 is allocation, which really comes down to what management wants to accomplish in the coming year.

  • Let’s say you just finished development of a new product and now you want to really hammer on selling it. In that case, you might allocate most of that incremental budget to sales in the coming year to accomplish that goal.
  • Perhaps you have an ambitious product development agenda for the coming years. Here you might allocate more incremental budget to your R&D team (yay say all the scientists!).
  • Or maybe you know that your product volume is increasing, for instance, in your clinical testing lab. In this case, investments may be needed either on the operations front to directly support that increase (headcount, equipment, etc) or on the R&D front to create workflows that will scale to support the increased testing volume.
  • Lastly, you may have objectives around returning money to shareholders, reaching profitability, or stockpiling money for an impending recession. In these cases, you may choose to not incrementally increase any department’s budget beyond what is absolutely necessary, in order to create shareholder value (higher investor confidence, leads to higher valuations and access to capital).

Of course, all of this illustration was done in the happy scenario of a growing company. If your company is on a downward trajectory, then the math gets inverted. Whose budget is being cut and by how much? Unfortunately, this scenario is all too common this year.

Making sense of ‘mismatched’ budgets

And there is a good perspective to be gleaned for scientific leaders in our current economic reality. We all love to see our teams grow; in good times and bad, most of us feel like we don’t have quite enough resources to accomplish everything we want. However, every new headcount we ask for should be carefully considered. In hiring, we are making a commitment to another person, to their career, and their future. We have a responsibility to these potential new hires and our existing teams to not get too far out over our proverbial skis— the budget has to bear the new headcount this year and in years to come. We need to take a longer view than the resource constraint we see in front of us, and ask ‘can we make this long term commitment at this point?’ and ‘how else might we meet the resource need in front of us?’

At a very high level, that’s the gist of budgeting: figure out what you can afford in the current market conditions given the strategic direction of the business, and allocate it on things that advance your key objectives for the year. So next time your department does not get the budget you were expecting, use it as an opportunity for understanding an alignment: ask how the allocation makes sense given how the company is doing financially and what the company is trying to accomplish in the coming year. Getting clarity on those two things will almost certainly help you be more effective in leading a scientific function.

In the next post, we’ll get back to our regularly scheduled programming and discuss key financial ratios and why they are important.

Illustration of a scientist looking at three pipes with money pouring out of them at different rates, representing different aspects of a cash flow statement

The Anatomy of a Cash Flow Statement: Operating, Investing, and Financing

Recall from last time the cash flow statement from BioTechne, and the three main sections.

  1. The first part describes cash flow from operating activities.
  2. The second part is cash flow from investing activities.
  3. The third part is cash flow from financing activities.

Screenshot of the BioTechne Cash Flow Statement

Let’s take these sections one by one.

Operating Activities

As is typical, the first part of the BioTechne cash flow statement describes cash flow from operating activities.

This is the cash the business collected from customers, minus all the cash that was left as any part of the process of producing goods or delivering services for customers. Many consider this category to be the single most important number for understanding the health of the business, because it signals how well the company is doing at turning profits into cash.

In our current economy, many biotech companies are dreaming about having a healthy operating cash flow. This is because a healthy operating cash flow means that further company growth can be internally funded, instead of needing to borrow or sell stock. And when interest rates are high and stock prices are low, external funding options are not particularly attractive.

Investing Activities

The second part is cash flow from investing activities.

Here we find available-for-sale investments, additions to property and equipment, and acquisitions. This section tells us something about how much cash the company is spending on investing for the future. If this number is low relative to the size of the company, then management may be treating the company as a ‘cash cow’ or potentially positioning itself for an acquisition. If the number is high, the company likely has high hopes for the future.

Let’s briefly compare BioTechne to Beckton Dickenson and Illumina on this front by making up a ratio so we can normalize by company size: cash flow from investing (amount spent in investing, so this is actually a negative number)/net income. For BioTechne in 2023, this ratio is 260,893,000/ 835,382,000 = 0.31, this is considerably higher relative to the previous year: 78,281,000/817,371,000 = 0.096. For BD, we get 3,220,000,000/18,870,000,000 = 0.17. For Illumina, 591,000,000/4,584,000,000 = 0.12. In the case of BioTechne in 2023, we see a big investment in Wilson Wolf, a manufacturing firm that invents, designs, and manufactures innovative cell culture devices and associated ancillary products, which accounted for almost 90% of the total investments.

Financing Activities

The third part is cash flow from financing activities.

This is where we find the cash transfers involving the owners or creditors of the business. We see debt repayment, new debt, share repurchases or issues, dividend payments, etc., all here. This category is where we can see the extent to which the company is dependent on outside financing. A positive number here indicates that cash has come into the company through financing activities. A negative figure here indicates when the company has paid out capital, such as retiring or paying off long-term debt or making a dividend payment to shareholders.

For BioTechne, comparing the last couple years is pretty interesting: in 2022 BioTechne used $177,125,000 in financing activities (repurchasing common stock and paying off long-term debt), whereas in 2023, 46,838,000 was provided by financing activities (cash coming into the business, primarily through a line of credit agreement worth 619,661,000, while also paying off long-term debt).

I was a little curious about this part, so I dug around in the footnotes and found this statement:

“In October 2018, the Company entered into forward starting swaps designated as cash flow hedges on outstanding debt. The forward starting swaps reduce the variability of cash flow payments for the Company by converting the variable interest rate on the Company’s long-term debt described in Note 6 to that of a fixed interest rate. … In May 2021, the Company entered into a new forward starting swap designated as a cash flow hedge on forecasted debt. The forward starting swap reduces the variability of cash flow payments for the Company by converting the variable interest rate on the Company’s forecasted variable interest long-term debt to that of a fixed interest rate.”

Aren’t footnotes fun? 😉

Summary Section

After the cash flow from financing activities, you can see a summary section:

Screenshot of a summary from the BioTechne Cash Flow Statement

One interesting thing to notice here is the first line, ‘Effect of exchange rate changes on cash and cash equivalents.’ If you recall from our very first substantive post on finding financial statements using EDGAR and its utility in learning a new-to-you business, BioTechne listed international exchange rates (the price of one currency expressed in terms of another currency) as one of their financial risks, as is fairly typical in the Life Sciences. Let’s dig into this topic a bit further here.

Whenever a company from one country does business in another, the financial health of its operations will be affected by changes in exchange rates. Let’s say you buy 96-well plates from China, at a price of $0.50 USD per plate, and you are buying ~200,000/month, for a total of $100K transacted per month. With an exchange rate of ~$1 USD for 7 Chinese Yuan, you are paying 700K Yuan for these plates, or 3.5 Yuan per plate. Now let’s imagine the exchange rate changes to $1 USD = 7.5 Chinese Yuan. Each plate still costs 3.5 Yuan, but you now need only $0.47 USD for each plate, meaning your monthly order just got cheaper by ~$7K USD. The opposite situation, where the Yuan becomes stronger against the dollar as it did in the beginning of 2022, will lead to your monthly order costs effectively going up. This example is pretty simplistic, but hopefully it provides a sense of why exchange rates are important for companies with global supply chains.

And that concludes our consideration of the cash flow statement, and wraps up our dive into the three main financial statements (income statement, balance sheet, and cash flow statement).

In the next post, we’ll move on to touch on key financial ratios and why they are important. It’s not too late to join the mailing list to receive an update when it’s published!

Navigating a company’s financial condition with the cash flow statement

“Cash is king,” or so they say. Let’s see how this plays out in the Cash Flow Statement.

We’ve already covered two of the three foundational financial statements— the balance sheet and the income statement.

The balance sheet told us about what the business owns, and what it owes. We use that information to understand the potential to create value for customers.

The income statement told us about the profitability of the business, or how much it costs to generate each dollar of revenue.

Let’s now turn to the third and final foundational financial statement.

The Cash Flow Statement

The cash flow statement is a recording of all the cash that entered and left the business over a period of time. It’s also the financial statement least subject to biases that creep in due to assumptions and estimates. The famous investor Warren Buffet is known to put the greatest emphasis on the cash flow statement when he examines financial statements, paying particular attention to ‘owner earnings.’  The owner earnings (also known as “Free Cash Flow”) can be calculated directly from the cash flow statement by finding the difference between the operating activities and the capital expenditures (i.e., the cash flow from investing activities).

The cash flow statement can provide insight into the financial health and status of an organization.

Specifically, by looking at the cash flow statement, we can answer the following kinds of questions:

  • What is the liquidity situation of the company (i.e., what can be readily converted to cash)?
  • What are the company’s sources of cash?
  • Is there free cash flow being generated to further invest in assets or operations?
  • Is the overall cash increasing or decreasing? How stable is it across different time frames?

The cash flow statement has an important structure. Below is the cash flow statement for BioTechne:

Screenshot of the BioTechne Cash Flow Statement

You can see in this example that there are three sections.

  1. The first part describes cash flow from operating activities— cash flow that’s generated once the company delivers its regular goods or services
  2. The second part is cash flow from investing activities— cash flow from purchasing or selling assets (both physical and non-physical property) using cash, not debt (sometimes referred to as capital expenditures)
  3. The third part is cash flow from financing activities— cash flow from both debt and equity financing

Finally, there is a summary section at the bottom that looks like this:

Screenshot of a summary from the BioTechne Cash Flow Statement

This section tells us whether BioTechne is cash flow positive or negative in the ‘Net change in cash and cash equivalents’ line. So in both 2022 and 2023, BioTechne was cash flow negative, meaning the cash outflow was higher than the cash inflow during that period.

Cash flow vs. profit

Negative cash flow doesn’t necessarily mean profit is lost. Instead, negative cash flow may be caused by a company’s decision to expand the business and invest in future growth. It can also indicate an expenditure and income mismatch, which should be addressed as soon as possible.  Similarly, positive cash flow, while ideal, does not necessarily translate to profit. A business can be profitable without being cash flow-positive, and can have positive cash flow without actually making a profit (often through borrowing money).

Here it’s important to remember that profit is typically defined as the balance that remains when all of a business’s operating expenses are subtracted from its revenues, it answers the question: how much money is left over from selling a product after all expenses from producing it have been paid? This is fundamentally a different question than what cash flow answers, which centers more around whether a company has enough liquidity or cash to pay its expenses.

In a nutshell, this is why it’s important to look at financial statements together.

We’ll dig in more to the three sections of the cash flow statement in our next post. Stay tuned with via the mailing list for updates!

Illusration of a scientist examining concepts from the liabilities and equity portions of a financial balance sheet

Decoding Financial Health with Liabilities & Equity from the Balance Sheet

Back to the balance sheet, specifically liabilities and equity.

In the previous post, we mentioned the fundamental equation of accounting:

Assets – Liabilities = Equity

We also walked through an example of assets from the BioTechne balance sheet.

Looking at liabilities

Now, let’s look at Liabilities. Quite simply, liabilities are what a company owes. 

Let’s take a look at BioTeche’s liabilities in their 2022 Balance Sheet.

Screenshot of the Liabilities portion of a Bio-Techne Balance Sheet

Here we see (balance sheet language is in parentheses):

  • The payments owed to the company’s vendors, e.g. service companies, raw material providers, etc. (Trade accounts payable),
  • future payment of employee salaries, benefits, etc. (Salaries, wages, and related accruals),
  • catch-all bucket (Accrued expenses),
  • pre-paid goods and services owed to customers (Contract liabilities),
  • expected taxes owed in the next 12 months (Income taxes payable),
  • lease payments due over the next 12 months (Operating lease liabilities- current),
  • expected near-term conditional payments that were agreed upon during an acquisition (Contingent consideration payable),
  • the amount of loans that due this year (Current portion of long-term debt obligations),
  • …and so on…

Just like the asset section, you can see there are two chunks of numbers for liabilities.

Any liabilities that require us to part with cash in a year or less are “current liabilities”. If we expect our cash outlay to come over a year in the future, we are dealing with “noncurrent liabilities”.

Equity in the equation

Now we get to equity.

Owners’ equity as what’s left over once you subtract liabilities from assets. It includes the capital provided by investors and the profits retained by the company over time. As you can see in the BioTechne balance sheet below, equity is referred to as ‘Shareholders’ equity,’ which is common, as is ‘Stockholders’ equity.’

Here’s what the equity portion of the BioTechne balance sheet looks like:

Screenshot of the Equities portion of a Bio-Techne Balance Sheet

The big picture from the balance sheet

We’ll close our introductory balance sheet conversation with a quick zoom out on how to use the balance sheet to evaluate a company’s financial health.

  • Is the company solvent? Is equity a positive number?
    • for BioTechne, the answer is yes
  • Can the company pay its bills? How do the current cash assets compare with liabilities?
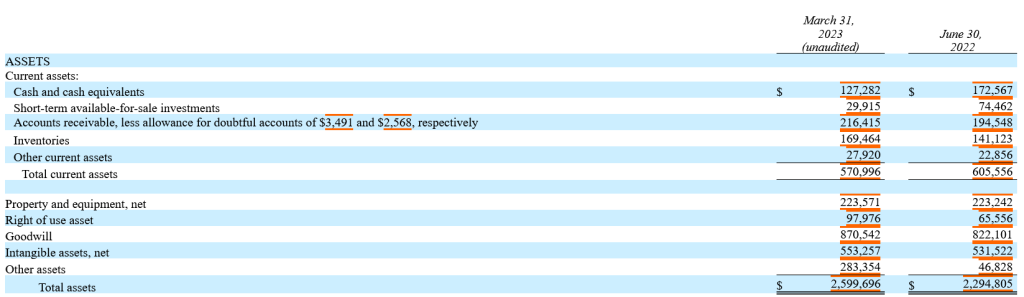
    • cash for BioTechne is at ~$127M and current total liabilities are at ~$141M, which looks bad at first glance, until you notice that there are $217M in accounts receivable, so BioTechne seems quite likely to be able to pay its bills
  • Is the financial health of the company moving in the right direction? Is the equity increasing over time?
    • for BioTeche, this is a yes

You can quickly get answers to these very basic questions from the balance sheet. Investors and other interested parties can also dig deeper to get a more complete picture of a company’s financial health and prospects through the balance sheet, the ever-important footnotes, and careful comparisons to other financial statements.

A few deeper questions to consider: how important is ‘goodwill’ to the company’s total assets line? What assumptions have been used in depreciation and amortization? Is equity rising because the company is making money or because of an inflow of capital?

Let’s quickly look at goodwill for our BioTechne example. In 2023, goodwill accounts for just over 30% of BioTechne’s total assets, which seems pretty hefty. But for our comparator, Becton Dickenson, goodwill is nearly half of its total assets in 2023. For Illumina in 2023, it was ~25%, down from 46% in the previous year (interesting to dig into why, but that will have to wait for another day).

I hope you see how much we can learn about a company just by studying its balance sheet. We get real insights into its viability, and the tools available for future growth.

In the next part, we’ll move into the wonderful world of cash flow. Sign up for the mailing list so to stay updated!

Illustration of a scientist reviewing symbolic representations of company assets, like invoices, equipment and real estate

Assets: tangible, intangible, and goodwill

Let’s talk about balance sheet structure, starting with a focus on Assets.

Below is the balance sheet for our exemplar company, BioTechne:

Screenshot of Bio-Techne Balance Sheet

The first part of the balance sheet is a list of the company’s assets, shown below:

Screenshot of the Assets portion of a Bio-Techne Balance Sheet

Assets are what the company owns: cash and securities, equipment, inventory, intellectual property (IP), real estate, ‘goodwill’ (stay tuned), anything a company could use to create economic value for its customers.

Life science asset examples

Now let’s steer this toward life sciences— what kind of assets would a life sciences company have?

Taking a look at the BioTechne balance sheet, we see (balance sheet language is in parentheses):

  • cash on hand (cash and cash equivalents),
  • inventory ready to sell (short-term available-for-sale investments),
  • cash they’re owed from customers (accounts receivable),
  • inventory that is either raw materials or in the process of being made, or products ready for sale (inventories),
  • physical assets the company owns (property and equipment, net),
  • assets the company is leasing (Right of use asset),
  • difference between the physical assets of an acquired company and what the acquiring company paid; reputation, customer base, and other so on- see below (Goodwill),
  • non-physical assets like employees skills, customer lists and relationships, proprietary knowledge, patents, reputation, data, etc. (intangible assets),
  • anything else the company owns (other assets),

In the balance sheet asset section, you can see there are two chunks of numbers.

If assets are either cash, or we expect to turn them into cash in a year or less, then we call them “current assets”. These are in the first block of figures.

If, however, the assets will not turn into cash in a year or less, they are called “noncurrent assets”, although they are not called out as such in the BioTechne balance sheet.

Clearly cash and cash equivalents are already cash. They’re current assets.

Accounts receivable, or the cash we’re owed from our customers, are current assets. We expect to collect that cash within a year.

Likewise inventories, the stuff we have on shelves, are current assets, since we expect to sell it and collect within a year.

On the other hand, property and equipment, goodwill, and intangible assets will not be monetized within a year, so it’s a noncurrent asset.

Making sense of balance sheet’s ‘Goodwill’ assets

Before we move on to liabilities and equity, let’s talk about Goodwill and Intangible Assets (which includes IP generated by R&D).

Goodwill can be defined as “difference between the physical assets of an acquired company and what the acquiring company paid; reputation, customer base, and other so on.”

Let’s give this definition a little more concreteness with a hypothetical example, shall we? We know from reading other parts of the 10-K that BioTechne acquired Exosome Diagnostics in 2018. A little digging reveals that BioTechne paid $250 million in cash plus contingent consideration of up to $325 million due upon the achievement of certain future milestones. When this happened, the asset called ‘cash’ decreased by $250M, and, in order for the balance sheet to balance, all other assets have to rise by $250M; so far nothing has happened that would change liabilities or owners’ equity.

So what assets increase? Well, you have the physical assets that BioTechne got with this acquisition— physical things that can be sold. Maybe some lab equipment, servers or other computer equipment, perhaps even the physical lab space. These assets are not likely to constitute the bulk of the $250M cash up-front that BioTechne paid. In fact, the CEO at the time said, ““ExosomeDx’s technology is a game changer and positions Bio-Techne to be a leader in the rapidly growing noninvasive liquid biopsy market.” And a Fierce Biotech article at the time stated, “With the deal, Bio-Techne is also getting about 200 of Exosome’s filed patents and applications of technology focused on new diagnostics in various pathologies with either difficult or no current diagnostic solutions, such as prostate, bladder, kidney, breast, glioblastoma and other cancers.” In other words, quite a lot of the value the BioTechne expected to get out of the ExosomeDx acquisition (at least publicly) was in (1) market positioning and (2) intellectual property, proprietary knowledge, and employee skills. Except for the patents, which could potentially be sold, these items fall into the bucket of ‘Goodwill.’

As you are probably gathering, goodwill is a bit squishy and too much of it on a balance sheet is probably a signal to be a bit wary. This is particularly true as goodwill is not amortized, so unlike the physical items gained in the acquisitions, which will depreciate over time, goodwill assets will continue to sit on the books.

IP, patents, and other intangible assets are an important aspect of the balance sheet for anyone leading an R&D organization to understand. Consider: how do you account for the cost of creating a new asset, like a reagent kit or clinical assay, that you expect to generate revenue for years to come? Just like we saw with depreciation in the income statement section, you don’t record the whole cost upfront, as it will generate revenue over time (remember in the income statement you are trying to abide by the ‘Matching Principle’). If you choose to amortize your R&D, then your assets and profitability will look better in the short term (just like the example of depreciation we worked through in a previous section). A more conservative approach is to expense R&D as it is incurred. So as we saw with depreciation in physical assets, there is room for shenanigans with intangible assets as well that impact both equity on the balance sheet and profitability on the income statement.

In the next part of this series, we’ll cover the liabilities and equity side of the balance sheet. You can sign up here to join the mailing list so you don’t miss it.

Illustration of various elements of a balance sheet, such as patents, cash and due invoices, sitting in balance on a seesaw

Using the Balance Sheet to Understand a Company’s Financial Health

To review, the big three in terms of financial statements are:

  • the income statement,
  • the balance sheet, and
  • the cash flow statement.

In this post, we will talk about the importance of a balance sheet.

Remember that a balance sheet tells us what a company owns, i.e. its assets, versus what it owes, i.e. its liabilities.

Equity measures the extent to which assets exceed liabilities, and is what “belongs” to the owners of the company.

Assets and liabilities are connected with equity via the fundamental equation of accounting:

Assets – Liabilities = Equity

Why do we care about balance sheets?

First, healthy companies have more assets than liabilities. And looking at how assets, liabilities, and equity have trended over time helps us understand whether a company is getting healthier or sicker.

Profitability (discussed in the income statement section) relates to equity, in the same way a grade in college relates to your overall GPA. You can think of profitability sort of like a single course grade, whereas equity is more like your grade point average. A single course grade will influence your GPA, but it doesn’t define it. Similarly, a strong quarter of profits will increase the equity in your balance sheet, and vice versa. Over time, the equity reflects the accumulation of profits and losses.

Second, balance sheets tell us about leverage (here’s a fun vocabulary lesson for you: a financial analyst’s word for debt is leverage). How much debt does the company rely on?

The higher the debt load, the higher the company’s debt service costs, which reduces its ability to invest or spend in other ways.

Balance sheet takeaways

These are the kinds of questions about a company’s financial health that you can answer with the balance sheet:

  • How much debt does the company have relative to equity?
  • How liquid is the business in the short term (less than one year)- can it pay its bills?
  • What percentage of assets are tangible and what percentage comes from financial transactions?
  • Is the financial health of the company moving in the right direction- is the equity increasing over time?

Short post for today, but next time we’ll dig into the first part of the balance sheet: Assets, including a particularly interesting asset category called ‘Goodwill.’

Stylized illustration of a scientist examining money, signifying profits, with a magnifying glass

Profitability: the proverbial and literal bottom line

We’ll close out the income statement with a look at profitability.

Again, we’re still anchored on the income statement with this portion of our analysis.

In prior posts, we first looked at revenue, then operating costs.

If we isolate only operating revenues, then pull out operating costs, we’re left with operating income. Divide operating income by operating revenue and we get operating margin.

(We can use the words “income” and “profit” interchangeably.)

Examples from Income Statements

So let’s go back to our BioTechne Income Statement again:

Screenshot of Bio-Techne Income Statement

In some cases, we’ll find gross profit, which lives above the operating profit line.

Gross profit is when we just subtract the direct costs of producing a good or providing a service. Recall from previous sections that gross profit can be greatly impacted by when a business chooses to recognize revenue and by decisions about what to include in Cost of Goods (CoGs).

We exclude operating costs like corporate overhead, e.g. selling, general and administrative expenses. We typically also exclude research and development expenses, since those are investments in future goods and services.

Note that for BioTechne the gross margin is almost 70%- pretty healthy. Just for fun, let’s compare the gross margin of our comparator, Beckton Dickenson.

Here’s their income statement. They don’t list out their gross margin for us, but we can calculate it by subtracting the second line from the first one: $8477, which gets us to a gross margin of ~45%.

Screenshot of Becton, Dickinson and Company Income Statement

If the gross margin is low, then management is very likely to hawkishly monitor the cost of sales. And if you are on the receiving side of that (either in R&D for future product improvements or in an operations function), then that’s a key piece of information you’d want to know to be effective.

Going back to the BioTechne Income Statement, next we see the operating expenses broken out by selling, general and administrative (sometimes called SG&A, and some companies break Selling and ‘G&A’ into separate lines) and R&D. This is then subtracted from the gross margin to give the operating income.

Pulling more meaning from the bottom line

Operating income or profit is a key to financial health— it shows the profit made from running the business. You may have heard the term EBIT in an earnings call. This acronym stands for Earnings Before Interest and Taxes, and is synonymous with operating income. Remember how we talked about all the shenanigans that are possible with depreciation and amortization? Well, due to outright fraud (beyond poor judgment or bias) being committed by some companies with those figures, Wall Street now prefers EBITDA, where the DA tacks on Depreciation and Amortization, which removes depreciation and amortization from the operating income to hopefully provide a more clear-eyed view of operating cash flows.

One other interesting thing to pay attention to here as someone in a scientific function is the percentage of gross margin a company is spending on R&D. In the case of BioTechne, R&D is about 11% of their gross margin. For BD, it’s about 14%. For Illumina, it’s close to 44%. Different sectors in life sciences will have very different investments, so it’s not a bad idea to poke around at a few financial statements to get a sense of what is standard and how a prospective employer, for instance, compares. Investors will sometimes look at something called Return on Research Capital (RORC), which is basically comparing the previous year’s R&D expenditure to this year’s gross margin. This might be somewhat challenging and discouraging for scientists.  When you work for BD, 14% is a lot bigger in real dollars than when you work for Bio Techne.

Below operating income or profit, you find a compendium of other line items that we will skip over here (you can see that these are generally smaller dollar values than what we’ve already covered), before finally arriving at Net Profit. Or, as it’s called on the BioTechne Income Statement, ‘Comprehensive Income Attributable to BioTechne.’ This line is the oft referred to ‘Bottom Line.’

To summarize: Revenue = Top Line, Profit = Bottom Line. To this day I have to pause to remind myself of the difference between Revenue and Profit, but there it is.

There is plenty more to the Income Statement that we aren’t covering here, but hopefully these posts have helped orient you to what’s included and how to parse it.

In the next post we will move on from the income statement and start to tackle the second financial statement in the trifecta: the Balance Sheet. Don’t forget to join the mailing list to be notified when it’s published!

Illustration of a scientist considering the effects of depreciation on the pipette she is considering buying

How expenses and depreciation can affect the profitability of your scientific work

In this post, we’re continuing our foray into the Income Statement, focusing on expenses. Our dive into expenses will include Research and Development (R&D) expenses, near and dear to any scientist. 

Let’s return once again to the now quite familiar BioTechne Income Statement:

Screenshot of Bio-Techne Income Statement

The second block of items in the Income Statement enumerates Operating Expenses. These are broken down into ‘Sales, General, and Administrative’ (sometimes you see this referred to as SG&A or G&A) and ‘Research and Development.’ Note that the line items here can change depending on the type of business you are in. If sales is a large part of your business, you may choose to have Sales as its own line, and G&A kept separate. Some business sectors may not pull out R&D as a separate line item, but this would be highly unusual for Life Science businesses, as R&D is a crucial part of our business models.

An important aspect of G&A for R&D leaders to understand is depreciation and amortization. How these expenses are handled can GREATLY impact the profit seen in an income statement. And while we’ll talk more about profit in the next section, I do want to pause briefly on the depreciation and amortization handling here.

Depreciation and amortization

First, some definitions. If you are like me, depreciation already feels like a somewhat familiar concept. Depreciation refers to both (1) the decrease in the value of assets over time and (2) the method used to reallocate, or “write down” the cost of a tangible asset (such as equipment) over its useful life span. In accounting, we are referring to the second of those definitions. Amortization is the same basic concept as depreciation, except it applies to intangible assets like patents, copyrights, and trade secrets.

To really understand depreciation and amortization, we need to resurrect ‘The Matching Principle’ referenced in the first post on the income statement. The matching principle seeks to match the cost with its associated revenue to determine profits in a given time period. For instance: you buy a fancy new Illumina Sequencer this year, but the expectation is that it will help to bring in revenue for the next 5+ years, so some percentage of that initial cost of the sequencer needs to be recorded in future income statements. But how long exactly will this sequencer be (1) functional and (2) part of your clinical workflow? What the accountants decide can have a huge impact on the profit in the income statement.

Here’s a worked example. Let’s say you bought a NovaSeqX recently that put you back a cool $1M. Now let’s consider three different ways of approaching depreciation and see how it impacts profit for an imaginary CRO business in which you generate $900K in revenue and incur $500K in direct costs (technician salaries, reagents, etc) and $300K in overhead (rent, marketing, etc) in a given quarter. Scenario 1: we assume the sequencer will last us 5 years, so we depreciate it by $50K per quarter (cost – salvage value) / useful life; for simplicity I am assuming a $0 salvage value). Scenario 2: we assume the sequencer will last us 2 years, which then gives us $125K per quarter depreciation. Scenario 3: we assume we’ll be using this sequencer for the next 10 years, which puts quarterly depreciation at $25K per quarter. In the table below, you can see that in scenario 2, this business is now operating in the red, whereas things look pretty rosy in scenario 3.

(in $1000)Scenario 1Scenario 2Scenario 3
Revenue900900900
Cost of goods sold500500500
Gross Profit400400400
Expenses300300300
Depreciation5012525
Net Profit50-2575

There are two things to take away from this example: (1) profit can be significantly influenced by the assumptions you make in depreciation and amortization and (2) these assumptions should be part of considerations to make significant capital investments. So next time you argue for a capital investment, keep in mind how it will impact your company’s income statement, financial health, and, ultimately, also the stock price.  

In the next part of this series, we’ll take a more complete look at a company’s profitability. In the meantime, you can sign up to the mailing list to be updated when the next installment is out.

Income Statement Fun: What is included in the Cost of Sales and why you should care

In this post, we’ll continue our foray into the Income Statement and dig into costs and expenses, part 1: ‘Cost of Sales.’

Let’s go back to the BioTechne Income Statement from last time:

Screenshot of Bio-Techne Income Statement

You have net sales (revenue) at the very top, followed by the cost of these sales. Recall that one of the first things we learned about BioTechne was that ‘Bio-Techne Corporation is a global life sciences company that provides products and services for research and clinical diagnostics. Because they provide both products AND services, the cost of sales here includes both the Cost of Goods, or CoGs, that many of us are familiar with (i.e., the raw materials used in manufacturing) and Cost of Services.

Just like with revenue, there is nuance to what is and is not included in ‘Cost of Sales.’ And these nuances are important for anyone leading a scientific (or even operations) function to understand because it can frame the performance of your department to corporate and play into how your department’s targets are set.

Here are three examples:

  1. Let’s say you run a Biopharma-focused informatics team at a diagnostics company. A large part of what your team does is interface with your biopharma clients to understand their needs and return the right kind of analysis. But you also work on algorithms that are used in your company’s core bioinformatics pipeline. Finance could reasonably justify putting your team’s salaries as either part of the ‘cost of services’ or part of ‘R&D.’ This choice, however, will heavily influence how much scrutiny there is, as things ‘above the line’ (i.e., in the first block of items on the income statement) usually face far more scrutiny than those below the line, especially if your margins are low.
  2. Let’s say you run a scientific operations team. You will probably have specific CoGs targets to hit each quarter that are a big part of how you and your team are evaluated. In reviewing the numbers, you realize that there is an item around ‘contract administration’ listed against your CoGs. Does it belong there? Can you reclass that as G&A (general and administration)? If you do, your numbers are going to suddenly look better, so in a bad quarter, you may be tempted to push for a reclass.
  3. Imagine you are in charge of running a CLIA lab at a diagnostics company. Some part of the environmental controls (i.e., air conditioning and heating) control the temperature of the CLIA lab space, and some part is used for the office space. What portion is attributed to ‘Cost of Sales’ and what portion should go under G&A (general and administration)? Do you use square footage? Do you allocate the cost in the same way for IT expenses?

Just like with revenue recognition, there is a large amount of discretion allowed here, but it’s also easy to see how things can get wonky.

That’s the basics for costs. We’ll go through expenses in the next post. As always, you can join the mailing list so you don’t miss it!

A stylized illustration showing how earning revenue is discrete from creating, delivering or even selling products

What scientists need to understand about revenue and its recognition

Today we will talk about revenue.

Revenue seems like a pretty obvious concept: the dollar value of the products and services a company provided to its customers during a given period of time (remember the ‘Matching Principle’ we talked about in the last post?). 

There are some subtleties here, because in order to record something as revenue, it must have been ‘earned.’ If you are selling a reagent, then you must have shipped it to your customer. If you are performing a service, say running a diagnostic test, then you should have performed the work. Easy enough? Sure, but consider:

Say BioTechne allows a customer to order reagents ahead of when they will need them (for instance, maybe the customer is looking to control the number of lots they have), but because this is a particularly important, high volume account, BioTechne is willing to hold those particular lots of reagents until the customer needs them (i.e., you haven’t shipped them yet). When can they recognize that revenue?

Or let’s say the diagnostics side of the business, ExosomeDx, signs a multi-year pharma contract for processing and analysis of clinical samples. When do they get to recognize the revenue from that deal? When the samples are run? Or when the complete analysis is delivered to the client?

Let’s keep these points in mind as we look through the numbers. 

Below is the screenshot of the income statement for BioTechne:

Screenshot of Bio-Techne Income StatementYou have Net Sales, i.e., Revenue, listed at the very top. Yet another place where different terms are used for the same concept. If we look at the income statement of another company in the space, Beckton Dickenson, their top line is called out as Revenue.

Screenshot of Becton, Dickinson and Company Income Statement

When revenue reporting isn’t black and white

As we saw in the examples at the top of this post, there can be a fair amount of nuance in when and how to recognize sales, and tremendous pressure to make this figure look strong. And because of this, the place where the most accounting shenanigans happen is in revenue recognition. In fact, most accounting fraud occurs in the top line, but even non-criminal bias can land a company in hot water. 

A quick example of how (non-criminal) bias can creep in could be around service contracts when an instrument is sold. Let’s say customers purchase a 5-year service contract alongside an instrument. When do you recognize that income? The service at year 0 has not been rendered, so you can’t recognize all the revenue, but you can claim that most of the cost of that service contract has been in making the initial sale, so 75% of the revenue should be recognized up front. Equally legitimate would be to say that only a small percentage of the revenue should be recognized up front, because most of the cost is associated with servicing that machine down the line. It’s really a judgment call that depends on the particularities of the business. 

What’s interesting is that you can even change your revenue recognition strategy, although generally it’s fairly suspicious to be doing this often (remember “consistently applied” from the last post?). If there is a change in revenue recognition strategy, it would be called out in the footnotes— another reason why it’s not a bad idea to look through them. 

Another example of bias and uncertainty in revenue is the quality of the customer.  Will the revenue shipped actually be paid for? Have you given special consideration to the customer (6 months to pay for example)? Have you made promises (warranty) that the product will perform down the road (a product warranty)?  All of these factors can contribute to revenue uncertainty.  

Depending on where in an organization you sit, scientific and technical decisions you make may impact revenue and its recognition. Are you developing a stand-alone product? Is it part of an ongoing delivery schedule? Are other services attached to it? These questions might color the response your work gets from other stakeholders in your company if they’re targeting a particular revenue goal.

Those are the highlights for revenue. In the next two posts, we’ll get into the murky realm of costs and expenses. Make sure you’re on the mailing list so you don’t miss it!

Page 6 of 7

Powered by WordPress & Theme by Anders Norén