
Leadership in Biotech

Category: Finance for Scientists Page 1 of 2

Illustration of a scientist pitching a new project to a finance-oriented executive

Net Present Value: Making the Financial Case for Advancing Scientific Projects You Care About

Well folks, we really saved the best for last here. In our final post on Finance for Scientists, we’ll be talking about one of the single most valuable tool I have learned in my adventures in finance: Net Present Value.

Why is NPV such a helpful concept for scientists? Because this tool is used by your business and finance counterparts to decide whether a particular project is worth pursuing. It is used to answer the question: relative to the low risk option of holding onto the cash needed to fund a given new project, how much money could this project generate over a particular time horizon? Understanding how NPV is calculated can not only help you make better sense of your company’s decisions, it can also help you structure projects in such a way as to make them more likely to be palatable to upper management (play around with these tools a bit and you will have a whole new appreciation for why timelines are so important.)

So what is NPV?

Net Present Value (NPV) is a way of measuring how much money an investment will generate in the future, compared to how much it costs today. NPV takes into account the time value of money, which means that a dollar today is worth more than a dollar tomorrow, because you can invest it and earn interest.

NPV is a powerful tool and the finance professional’s first choice for analyzing capital expenditures. There are three key reasons for this:

  1. It takes into account the time value of money. Future cash flow is discounted to understand their value in today’s dollars.
  2. It considers a business’s cost of capital or other hurdle rate. Cost of capital is the return expected by those who provide capital for the business. Hurdle rate is the minimum acceptable rate of return investors use to analyze profitability when evaluating a potential investment. In other words, NPV takes into account the specific situation of the business (which you will see shortly includes current interest rates).
  3. It provides an answer in today’s dollars, allowing you to compare the initial cash outlay with the present value of the return.

So, to calculate NPV, you need to estimate the future cash flows (inflows and outflows) of the investment, and discount them by a certain rate that reflects the risk and opportunity cost of the investment. The discount rate is usually based on the cost of capital or the expected return of similar investments. The NPV is the sum of all the discounted cash flows.

The discounting equation looks like this:

PV = FV1/(1+i) + FV2/(1+i)2 + … + FVn/(1+i)n

PV = Present Value

FV = projected cash flow for each time period

i = discount or hurdle rate

N = number of time periods (typically years in biotech/diagnostics) you are looking at

NPV = PV – initial cash outlay

For example, suppose you want to invest in a new diagnostic device for a rare disease. You estimate that the device will cost $10 million to develop and launch, and will generate $2 million per year for 10 years. You also estimate that the discount rate for this project is 10%, which means that you expect to earn 10% per year on average from similar investments.

To calculate the NPV, you need to discount each cash flow by 10% per year.

So, for the first year, the discounted cash flow is:

$2 million / (1 + 0.1) ^ 1 = $1.82 million

For the second year, it is:

$2 million / (1 + 0.1) ^ 2 = $1.65 million

And so on, until the tenth year:

$2 million / (1 + 0.1) ^ 10 = $0.77 million

The NPV is the sum of all these discounted cash flows, minus the initial cost of $10 million:

NPV = ($1.82 million + $1.65 million + … + $0.77 million) – $10 million

NPV = $3.17 million

This means that investing in this device will generate a net profit of $3.17 million in today’s dollars, after accounting for the time value of money and the risk of the project.

However, this calculation assumes that the cash flows are certain and constant, which is rarely the case in reality. In practice, there are many uncertainties and risks involved in developing and launching a new diagnostic device, such as regulatory approval, market demand, competition, pricing, reimbursement, etc. These factors can affect both the amount and timing of the cash flows.

To account for these uncertainties and risks, some analysts use a modified version of NPV called risk-adjusted NPV (r-NPV). r-NPV adjusts each cash flow by multiplying it by a probability factor that reflects the likelihood of achieving that stage of development or commercialization. The probability factor is usually based on historical data or expert opinion.

Interest and Discount Rates vs. Your Research Project

Let’s talk briefly about interest rates and their impact on discount rates. Having never taken an economics class before, my mind was blown the first time someone walked me through this information, and it certainly has helped me better understand our current macroeconomic headwinds and Wall Street’s collective obsession with interest rates.

Higher interest rates mean a higher opportunity cost for funds. If your CFO uses a hurdle rate of 20%, it means she is pretty darn confident she can get almost that much return elsewhere for a similar level of risk. A high hurdle rate then sets a very high bar for new investments. When interest rates are high, there is always the low risk option of just sitting on your cash and still getting a pretty attractive return. So high interest rates increase the bar for investment. Similarly, if you need to raise capital to invest in this new opportunity, the cost of that capital will be higher due to the higher interest rates.

Conversely, if interest rates are very low, almost everything is better than sitting on your cash, so there is pressure for growth and investment. This situation was responsible for the halcyon days of 2019-2021. But as we are seeing now, because time scales are long in the biotech and life sciences sector, companies can get caught out by assuming that low interest rate/cost of capital days will last forever. And we are seeing this situation play out now as companies jettison development programs in order to preserve cash in the current economy (i.e., the discount rate has changed, so NPV calculations done in 2021 likely do not hold in 2024, and some opportunities are no longer worth pursuing— another reason why everyone likes shorter project timelines).

In summary, interest rates and NPV have the following relationship:

  • As the interest rate increases, NPV decreases, and the bar for what a good investment is increases
  • As the interest rate decreases, NPV increases, and the bar for what a good investment is decreases

One other important factor for scientists to consider in NPV calculations (which WILL be used to evaluate whether your pet project is worthwhile), is how the cost of the project is being estimated and how the projected cash flow is being estimated.

To do that, let’s go all the way back to the beginning of this series and think about the income statement. To refresh your memory, below is our favorite BioTechne example:

Screenshot of Bio-Techne Income Statement

Many of the line items here will be used to estimate projected returns, so you need to know how your particular project is being ‘burdened,’ for example, with SG&A.

Quick example: let’s say you are developing a new product that runs on top of an existing platform. It will require some R&D investment, but because you are leveraging an existing platform, those costs are smaller than a new product that requires a totally new platform to be built. So your initial cash outlay will be smaller. Similarly, operating costs associated with running something on an existing platform will be relatively low (and scale with product volume). As a result, as you are calculating your projected cash flow, you would want to include some incremental operating costs in the first years after launch that then scale with sample volume. Conversely, if this new product requires building out a new sales and marketing team, those expenses can dramatically decrease the return expected in the early years after launch. However, if you are creating a new offering for an existing sales channel, then your returns will be higher. G&A can usually be approximated as a percentage of overall volume.

All of these details will be important to understand as you are thinking about starting a new line of research, and then to consider more carefully (and this part is usually led by finance) when putting together the business case. Having your own understanding about these calculations can help you challenge assumptions that your finance team may be making that cause the business case to look significantly worse than it ought to. Similarly, as a savvy scientist, you can perhaps think about ways to decrease the upfront spend or brainstorm with your business development and marketing colleagues on alternative routes to revenue in the early days post product launch (can you reach some customer segments through existing channels? Are there channels that have lower regulatory or reimbursement requirements that can be accessed sooner? etc.). And by running a minimal NPV analysis for yourself in the initial concept phase of projects, you can get a feel for the likelihood of eventual success and prioritize your efforts accordingly.

I could probably write another 3 posts on NPV, if this topic is of sufficient interest to folks (reach out in the comments).

Otherwise, I will leave you with a few useful resources as I close out the final planned post of this series!

Thanks for following along! And a big thank you to Jeff Krimmel for inspiration and the authors of Financial Intelligence. A Manager’s Guide to Knowing What the Numbers Really Mean (Karen Berman and Joe Knight) for their easy-to-read book on finance!


An illustration of a scientist looking up at a sort of monument to the the Big Five financial indicators, each perched on top of an Greek ionic pillar

The “Big Five” Numbers — What Investors Care About and Why

In this post, we cover the ratios and other financial indicators Wall Street or other outside investors care about. These ratios can have a large impact on managerial decisions, because companies generally need to keep shareholders and investors happy and how well leadership does in this endeavor will impact stock price, which in turn influences the success of a company.

Here are the ‘Big Five’:

  1. Revenue Growth
  2. Earnings per Share (EPS)
  3. Earnings Before Interest, Taxes, Depreciation, and Amortization (EBIDTA)
  4. Free Cash Flow (FCF)
  5. Return on Total Capital (ROTC)

Let’s dive deeper.

Revenue Growth

This metric measures how fast the company is increasing its sales over a period of time. A high revenue growth rate indicates that the company has a strong demand for its products or services, and that it can scale up its operations. No investor is going to put money in a company where the value of their investment will stay flat or decrease over time (okay— well there are really sneaky things people do with the intention of decreasing their tax liability, but we’ll set that aside for now). If a company wants to be successful, they need to show the potential for growth.

Earnings per Share (EPS)

First up is EPS, which we encountered in the last post on Earnings Calls. This metric measures the profitability of a company by dividing its net income by the number of outstanding shares. EPS reflects the earnings potential of a company and its ability to generate returns for shareholders. All other things being equal, a growing EPS portends an increase in stock price. In an economic slowdown, companies will work hard to keep EPS up by reducing costs (not always great for the humans working at these companies). Shareholders can accept revenue decline, but are unhappy to see a decrease in EPS.

Earnings Before Interest, Taxes, Depreciation and Amortization (EBITDA) margin

This metric measures how much of the revenue is left after deducting the operating expenses, excluding interest, taxes, depreciation and amortization. A high EBITDA margin indicates that the company has a high profitability and cash flow generation; it’s a good indicator of future operating cash flow. EBIDTA is also often used in valuing a business, as a company’s sale price is often negotiated as a multiple of EBIDTA.

Free Cash Flow (FCF)

This metric measures the amount of cash that a company generates from its operations after deducting capital expenditures. FCF indicates the financial flexibility of a company and its capacity to invest in growth opportunities, pay dividends, reduce debt, or repurchase shares. In this economic climate, it’s especially important, as a company with a healthy free cash flow can continue to fund its own growth even when investment dollars are hard to come by.

Note that EBIDTA and FCF can be used together to understand how well a company is doing at converting profit to cash, by taking the ratio of FCF divided by EBIDTA. When this ratio is low, it can mean that a company is trying to make EBIDTA look strong through gimmickry even while its cash flow is weak.

Return on Total Capital (ROTC)

This metric measures a company’s net income relative to the sum of its debt and equity value, or the efficiency with which invested funds are used in a business.  Essentially it helps investors understand whether a business is generating a return high enough to justify their investment.

More terms of interest

A few other metrics investors care about: Market Cap, Price-to-Earnings, and Shareholder Value

Market Cap

Market cap is simply the current stock price of a company multiplied by the number of shares outstanding, which appears on the balance sheet under Capital Stock. This metric shows a snapshot of what the company is worth to investors. Savvy investors like Warren Buffett will look at the ratio of the market cap to the ‘book value,’ or the value of the equity as shown on the balance sheet. It is said that Buffett tries to find and invest in companies that are trading at market cap close to or below their book value, as this situation may indicate that a company is undervalued (note: another thing that is said about Buffett is that he invests only in businesses he understands, so I would imagine there is an element of critical thinking in determining whether the business is actually undervalued… also note, this strategy is inherently banking on the market eventually recognizing the value of a company in the LONG TERM).

Price-to-Earnings

This metric is the current stock price divided by the prior year’s earning per share, and measures how much the market is willing to pay for each unit of earnings. Companies with higher ratios are considered to have high growth potential.

Shareholder Value

This term does not point to any single concrete metric— in fact, every ratio discussed could be said to indicate ‘shareholder value.’ But regardless of the specific definition, increasing shareholder value is important to everyone— not just shareholders. Lenders, investors, employees, customers all like to work with/invest in companies with high shareholder value, as these companies are better positioned to survive through hard times, keep employees employed, pay back their loans, and offer more pricing flexibility. Total shareholder return (TSR), the stock price appreciation plus reinvested dividends over a period, is one way of looking at shareholder value, and is sometimes considered the ultimate measure of a company’s achievement for shareholders over the long term. The formula for calculating TSR is { (current price – purchase price) + dividends } ÷ purchase price. Higher TSR results in greater capital gains for shareholders, stock price appreciation for employee-owners and potential for future success.

Long-term Investor Value Appropriation (LIVA)

A newer alternative metric is Long-term Investor Value Appropriation (LIVA). The idea behind LIVA is simple is to use historical data to estimate how much value a company either created or destroyed for its entire investor base. This measure is closely related to net present value (NPV), which estimates the value of a project based on expected future cash flow. NPV, which we will cover in the next post, is the gold standard for CFOs to decide which projects to invest in.

After the last several posts, hopefully you have a better understanding of how to understand financial ratios from management and investors perspectives (and how those perspectives come together in an earnings call).

In our next post we will talk about ways to understand ‘return on investment.’ In my mind, this is one of the most critical pieces of financial intelligence a scientific leader can acquire, as they will help you translate the value of the projects you want to advance into a framework your finance partners can more easily understand. So join the mailing list and stay tuned!

Illustration of a scientist listening to an office speaker phone. The phone has various speech balloons with icons to cover topics typically covered in a company earnings call

Your Company’s Quarterly Earnings Call: How to Make Sense of It All

An earnings call is a quarterly touch-base for publicly-owned companies to provide an inside look at their performance and expectations for the future.

Earning calls are not legally mandated, so a company doesn’t have to have one. However, almost all publicly traded companies host quarterly earnings calls, because they provide an opportunity for the company’s management team to explain and contextualize their most recent financial results, and to offer a small glimpse into the future. It also often provides the opportunity for investment analysts to engage directly with the company’s executives.

These quarterly calls align with a company’s fiscal year, which may be different from the calendar year. For instance, our favorite exemplar company, Bio-Techne, closed its third quarter in the spring, for instance.

You can either listen to these calls live via webcast. Or you can listen to the recording on the company’s website a short while after the call occurs. Or you can read the transcript of the call, which is what I most often do.

Let’s walk through Bio-Techne’s third quarter earnings call to better understand the structure and content of a typical earnings call. A transcript of this call can be found here: https://seekingalpha.com/article/4599539-bio-techne-corporation-tech-q3-2023-earnings-call-transcript 

Safe harbor statement

A call usually begins with a safe harbor statement, which lets everyone know that financial results may include predictions about the future that may not necessarily come true. This disclaimer limits the company’s liability if the predictions about the future differ wildly from what the future actually brings.

In this part of the BioTechne earnings call, they also state, “During the call, non-GAAP financial measures may be used to provide information pertinent to ongoing business performance.” Recall from our early posts (Part 2), that GAAP stands for Generally Accepted Accounting Practices and are standardized accounting practices utilized in ensuring that financials are accurately recorded and managed. The justification for reporting non-GAAP earnings is that large one-off costs, such as asset write-downs or organizational restructuring, should not be considered normal operational costs because they distort the true financial performance of a company. In other words, context.

Presentation and discussion of the financial results

Once the Safe Harbor statement is out of the way, the CEO (in this case Chuck Kummeth) kicks off with some opening messages that essentially boil down to a sales pitch for the company. Typically the CEO will present a narrative designed to coach listeners about the company’s position in the market and how they should think about the subsequent information. As a result, this section gives listeners a deeper understanding of how the company is positioning themselves in the market, and how optimistic they are about competitors and external market forces.

In the case of the Bio-Techne call, Chuck opens with all the things investors should be happy about (milestones, strong growth, etc), and then talks about “continued challenges of COVID in China, lower biotech funding and OEM destocking from supply chain disruption concerns last year,” but ends with an optimistic statement about these headwinds decreasing in the coming year. He also welcomes a new senior leader to the company, and then dives into performance by geography and end market, essentially fleshing out the themes he opened the call with.

Following the pattern of a typical earnings call, they then move into the detailed financial section, where the CFO takes the baton and dive into numbers that will give investors a sense of the relative health of the business and how that compares to past periods. In the Bio-Techne earnings call, the CFO (Jim Hippel) starts with the EPS (earnings per share). We’ll cover EPS in the next post on the investor Big Five financial ratios, but here’s a sneak preview:

EPS measures the profitability of a company by dividing its net income by the number of outstanding shares. EPS reflects the earnings potential of a company and its ability to generate returns for shareholders. All other things being equal, a growing EPS portends an increase in stock price. In an economic slowdown, companies will work hard to keep EPS up by reducing costs (not always great for the humans working at these companies). Shareholders can accept revenue decline, but are unhappy to see a decrease in EPS.

Similar to the opening business statements, Jim starts with an overall perspective, and then goes through the financials from various geographies and business lines. At several points, he refers to ‘unfavorable foreign exchange’ as a headwind (to refresh your memory on how exchange rates can impact a life sciences company, see Part 12).

Q&A

The final, and probably most interesting, section on an earnings call is the Q&A, and it is usually the longest part of the call. The host company can call upon analysts in their preferred order, prioritizing the most relevant individuals and deprioritizing the rest. Some investors will consider the tenor of how an earnings call unfolds, paying close attention to how leadership explains key pieces of information and how they navigate analyst questions at the backend of the call.

One interesting exchange in this section was from Dan Leonard from Credit Suisse who asked, “I want to make sure I understood your summary comments appropriately. Did you say that Bio-Techne would return to double-digit growth in fiscal 2024?”

For context, the summary comments from the CEO included: “Through it all, and as Q3 demonstrated, our growth platforms are still winning with double-digit growth. As we enter Q4, some of the headwinds should diminish, especially in China, but some are likely to remain, namely the OEM destocking and smaller biotech rationalize spending.

Looking further ahead into fiscal year 2024, these remaining headwinds should further diminish a double-digit revenue increases we see in our strategic growth platforms to once again be reflected in our headline numbers. In the meantime, we expect Q4 overall momentum to continue to improve from Q2 and Q3 with an overall growth rate likely similar to how we started the fiscal year in Q1.”

The issue around OEM destocking comes up several times in the Q&A and warrants some additional context. OEM will be a term for those more connected with the manufacturing world- it stands for original equipment manufacturer, or an organization that makes devices from component parts bought from other organizations. Destocking is just what it sounds like- to reduce the amount of stock/inventory held. So OEM destocking here means that BioTechne’s OEM customers are cutting back on the inventory they are buying, which is obviously not great for BioTechne.

Let’s dig a bit deeper into the macro environment underlying this destocking trend. Pre-pandemic many companies tilted towards ‘JIT’ (just in time) inventory management practices- there are many reasons this practice is attractive for a company’s financial position (in the extreme: imagine how your cash flow statement looks like if you can sell and receive payment on inventory before you have to pay the vendors from which you bought the parts, because you’ve negotiated amazing terms- Net 90, for instance). But there is no free lunch, and JIT comes with risks to a company’s resilience, and during the pandemic massive supply chain disruptions made that risk very apparent. The upshot is that many distributors moved away from JIT and stocked up on inventory. In addition, many businesses diversified, strengthening their supplier base and giving them increased optionality with qualified sources for materials. So now with the pandemic now officially over, distributors are feeling more confident in ‘destocking’ a bit, or drawing down on that inventory. But it’s not only that, there are market pressures driving this destocking behavior as well. As we all know from the last 14 parts of this series, destocking will lead to an increase in operating cash flow. With debt markets enduring higher interest rates for at least the foreseeable future, CFOs are turning to alternative sources of capital, i.e., no one wants to borrow money at high interest rates if they don’t have to, so turning existing stock into products without replenishing it as quickly provides a convenient route to generate cash. This strategy may be great for the companies doing the destocking, but it’s not so great for the company’s selling the inventory that is now being destocked. Thus the BioTechne situation.

Okay, so with that context, what was the BioTechne’s response?

First the CFO chimes in, “Well, we’re in the process of building our plan right now for next year, right? What I was trying to indicate in my closing remarks was that if you take out the very isolated events OEM destocking. China, as an example, the ExoTRU deal and the rest of our business collectively is at double digits already. And our key growth programs, which are going to carry us to $2 billion and beyond are also all growing well in the double digits. And so it suggests that we get past these headwinds in fiscal year 2023, during fiscal year 2024, this underlying double-digit growth was seen not only in our core but definitely in our growth programs, growth platforms we’ll start to once again resonate and you’ll see it in the overall company results. And that’s our goal.”

And then the CEO pipes up: “Let me put a little ribbon on that. So, I mentioned our run rate – we watch our run rate and how we’re doing digitally with our catalogs. We are funded first and foremost, the catalog business for life sciences across the board, biopharma down through academia. And that’s remaining in teens tells us that things are okay. Then you look for other holes and we bridge it for you. This OEM thing is going to come and go, you pull that back, we’re back to normality. And on top of that, you have these growth programs. Our three top growth areas all hedged spectacular quarters. Spatial had double-digit, 45% GMP protein, 20%-plus in cell and gene therapy overall and Exosome at 87%. They’re not material enough right now to carry the average. But by next year, there are going to be a lot more material and they’re going to carry the average. So all the stuff fundamental coming back on top of these growth programs, we don’t give guidance, but we won’t be very happy here if we’re not a double-digit growth and so.”

This exchange highlights some of the richness of an earnings call. First, on this question both the CEO and CFO jump in to answer, one of the few times this happens in the Q&A, which may tell us something about the importance of the topic. Second, you can see the ‘hedging’ in language like, ‘we don’t give guidance, but we won’t be very happy here if we’re not a double-digit growth.’ And finally, you can see the narrative that BioTechne is advancing very clearly in this exchange: we have very strong growth areas and are optimistic that the headwinds bringing us down now are temporary and likely to improve in future quarters. Basically, they are trying to reassure investors about some less than spectacular numbers.

A few more notes on how to listen to an earnings call

If you are following a company for multiple quarters, you can gain insight from listening closely for what the company disclosed relative to what prior research or earnings calls suggested they would disclose. Which topics did they emphasize, and which did they de-emphasize?

You might hear the word “guidance” on an earnings call, which is a term used to describe how the company orients analysts and investors around their projected future performance. Guidances are often given in ranges and with the caveat that they are directional only, so take them with a grain of salt. In the case of BioTechne, the CEO explicitly states ‘we don’t give guidance, but…’ When guidance is given, it’s generally a good idea to give it a close listen because sometimes the changes made to the guidance do provide important insight into the company’s future.

As stated above, some investors pay close attention to the tone used when delivering information. Is the information being delivered with energy and optimism? Or do the presenters seem sheepish and concerned? Of course, these assessments are highly subjective and can lead to false signal (and are much harder to get at from reading a transcript), but some investors will factor them into their overall read of an earnings call.

I strongly urge you to dig through past transcripts to get a sense of how both management and investors are thinking about the performance of the business.

Just for fun, here’s an article on GenAI prompts for analyzing earnings calls: https://www.mlq.ai/prompts/earnings-calls/ 

Next time we’ll talk about the ‘Big Five’ numbers that investors care about, including revisiting EPS. In the meantime, you can join the mailing list to be notified of when that comes out!

Illustration of a scientist working at a chalkboard covered in pictures representing financial ratios

Making Sense of the Numbers Through Financial Ratios

In this post we will move beyond the financial statements and consider briefly a few key financial ratios and why they are important. 

In previous posts, we’ve sometimes evoked ratios to try to contextualize and compare various numbers in the financial statements. And in general, this is exactly what ratios are good for. In this post, we’ll cover four different categories of financial ratios: 

  • Profitability, 
  • Leverage, 
  • Liquidity, and 
  • Efficiency.

Profitability Ratios

Simply put, these ratios evaluate a company’s ability to generate profits. There are dozens of profitability ratios, so below I highlight some of the most important ones. 

  • Gross Profit Margin
    • What it is: Gross Profit Margin (sometimes called simply gross margin) = gross profit/revenue
    • Why it matters: Gross margin shows the basic profitability of the product and/or service itself, before expenses or overhead. In other words, how much of the sale price is going to the materials and direct labor to produce that product or service. 
    • What to pay attention to: 
      • Higher is generally better- if you can’t cover your direct costs by selling your goods, you won’t be in business long.
      • Trend lines are important- negative trend can mean that the company may be discounting sales to increase volume or CoGs is increasing (or both). A negative trend can be an early warning indicator that a business may be in trouble.
  • Operating Profit Margin
    • What it is: Operating Profit Margin (Operating Margin) = operating profit (EBIT)/revenue
    • Why it matters: Operating margin is a more comprehensive measure of a company’s ability to generate a profit, as it uses operating profit, or EBIT (earnings before interest and taxes), as a numerator.  Here you are looking at how well the company is running itself.
    • What to pay attention to: a downward trend is a signal for management (and investors) to pay attention- costs are rising faster than sales.
  • Net Profit Margin
    • What it is: Net Profit Margin (Net Margin) = net profit/revenue
    • Why it matters: This ratio indicates how much of every sales dollar a company gets to keep after everything else has been paid for. Net profit is that proverbial bottom line, to this is the bottom line ratio. People sometimes refer to this as return on sales, or ROS.
    • What to pay attention to: This ratio is highly variable from industry to industry, so it is usually most meaningful to compare a company’s net margin across time and/or compare with players in the same industry. 
  • Return on Assets
    • What it is: Return on Assets (ROA) = net profit/total assets
    • Why it matters: ROA tells you what percentage of every dollar invested in the business was returned as profit. Stated otherwise, this ratio looks at how well a company is putting its assets (cash, facilities, inventory, etc) to work.
    • What to pay attention to: Unlike the other Profitability Ratios we’ve discussed so far, ROA can be too high. An ROA above the industry norm can indicate that a company is not investing in its asset base for the future, which can compromise long term prospects. ROA varies from industry to industry, so like with the other metrics, it’s best to compare amongst peers within an industry. There are more nefarious reasons ROA can be inflated (remember Enron?), but we’ll set those aside for now. 
  • Return of Equity
    • What it is: Return on Equity (ROE) = net profit/shareholders’ equity
    • Why it matters: While assets refer to what the company owns, equity refers to its net worth as determined by accounting rules. So ROE indicates the profit made for every dollar of equity invested in the company. 
    • What to pay attention to: From an investor’s perspective, s/he’ll generally be looking for a ROE above the going interest rates and asking the basic question: is this company even capable of generating a return that is worth the risk of investment? From a financial health perspective, this ratio is a bit tricky vis-a-vis comparison to other companies. A company’s ROE can be higher than a competitor because it has borrowed more money. Whether this position is good or bad will heavily depend on how smart the company has been in borrowing money. 
  • Other/Variations on a theme
    • Return on net assets (RONA), Return on total capital (ROTC), return on invested capital (ROIC), and return on capital employed (ROCE) are some other profitability ratios. They all answer the same basic question: did the company earn enough profit to justify the amount of ‘other people’s money’ it is using?
    • Generic formula: (net income before interest on debt and after tax)/(total equity + total interest bearing debt)
    • For the sake of brevity, we will not go into more depth here.

Leverage Ratios

These ratios evaluate how (and how extensively) a company uses debt. Fun fact: a financial analyst’s word for debt is leverage. So now you know. Leverage allows companies to make more money, but it also increases risk, because it introduces fixed costs that cannot easily be cut in the case of revenue reduction. 

  • Debt-to-Equity
    • What it is: Debt-to-Equity Ratio = Total Liabilities/Shareholders’ Equity
    • Why it matters: This ratio is often used by bankers to determine whether or not to offer a company a loan. 
    • What to pay attention to: Managers should care about this ratio, as raising cash through borrowing may be more difficult if this ratio is high, and expansion could require more equity investment. 
  • Interest Coverage
    • What it is: Interest Coverage = operating profit/annual interest charges
    • Why it matters: The ratio shows how easy it will be for a company to pay its interest. Bankers love it.
    • What to pay attention to: High ratio indicates that a company can reasonably take on more debt. If this ratio is close to 1, it indicates that most of the operative profit is used to pay interest- not good. In that situation, senior management will need to focus on paying off debt. 
    • Side note: there’s a sneaky construct called an operating lease, where companies lease equipment from an investor instead of buying it- then these lease payments show up as an expense on the income statement, but there is no asset and so no asset-related debt. 

Liquidity Ratios

Simply put, these ratios evaluate how well a company is able to pay its bills.

  • Current Ratio
    • What it is: Current ratio = current assets/current liabilities
    • Why it matters: It provides a measure of the company’s cash runway.
    • What to pay attention to: Too high or too low is a problem. Too high suggests the company is sitting on cash instead of investing it or returning it to shareholders. Too low (close to 1) means that the company is just barely able to cover its liabilities with the cash coming in. If this ratio is less than 1, then the company is going to run out of cash in the coming year and needs to generate more cash or attract more from investors.
  • Quick Ratio
    • What it is: Quick ratio = (current assets – inventory)/current liabilities
    • Why it matters: Also known as the ‘acid test,’ this ratio is a variation on the Current Ratio, but subtracting inventory, which is harder to convert to cash quickly. In other words, this ratio indicates a company’s ability to pay off short-term debt without needing to wait for inventory to sell.
    • What to pay attention to: If a particular business has a lot of their assets tied up in inventory (for instance, a reagent or consumable manufacturer), then lenders and vendors will be looking to see that this ratio is well about 1.

Efficiency Ratios

These ratios evaluate how efficiently a company is managing its assets (and liabilities), which can have a direct impact on the company’s cash position.

  • Inventory Days 
    • What it is: Days in Inventory (DII) = average inventory/(COGS/Day)
    • Why it matters: This ratio measures the number of days inventory stays in the system. Inventory is somewhat ‘frozen cash,’ so the faster you turn it over, the better off you will be. It is used as a benchmark of operational efficiency.
    • What to pay attention to: What good looks like for this ratio will depend heavily on the industry, so best to benchmark to other players in your space.
  • Inventory Turnover
    • What it is: Inventory turns = 360/DII
    • Why it matters: If every item of inventory was processed at exactly the same rate, inventory turns would be the number of times per year you sold our your stock and had to replenish it. 
    • What to pay attention to: The higher the number of inventory turns, the tighter your management of inventory and the better your cash position. All else being equal, you want to increase this value. 
  • Days Sales Outstanding
    • What it is: DSO = ending accounts receivable/ (revenue/day)
    • Why it matters: This ratio is a measure of the time it takes to collect the cash from sales- how fast to customers pay their bills. Note that in the diagnostics space, this ratio may be high, as your payors are insurance companies, hospital systems, or the government, who aren’t necessarily known for their speediness.
    • What to pay attention to: Lower DSO means a stronger cash position. A high DSO can be a red flag, but it is important to contextualize this value based on the industry you are in.
  • Days Payable Outstanding
    • What it is: DPO = ending accounts payable/(COGS/day)
    • Why it matters: This ratio measures how long it takes a company to pay its own invoices. It’s the flipside of DSO.
    • What to pay attention to: A higher DPO means a stronger cash position, as you are holding onto your money for longer. However, this may not make your vendors very happy, so a balance must be struck. There are companies who have mastered the art of collecting payment from sales quickly, but paying vendors slowly, such that they have a very strong cash position. 
  • Property, Plant, and Equipment Turnover
    • What it is: PPE turnover = revenue/PPE
    • Why it matters: PPE turnover is a measure of how efficient a company is at generating revenue from fixed assets such as buildings and equipment. 
    • What to pay attention to: All other things being equal, the higher this ratio, the better the company is at putting its assets to work. However, companies may lease instead of buy equipment, which can make it challenging to compare across companies, as operating leases may not show up on the balance sheet (operating leases show up as an expense on the income statement).
  • Total Asset Turnover
    • What it is: Total asset turnover = revenue/total assets
    • Why it matters: Similar to PPE turnover, but looks at total assets, not just fixed assets. It measures the efficiency in the use of all assets.
    • What to pay attention to: This metric measures efficiency- tracking the trends here can help you measure your overall efficiency in using your assets.

In the next post, we will look at what ratios investors care about: the “Big Five” numbers. Please consider subscribing to be notified when it’s out!

Budgeting 101: Using our newly acquired financial intelligence to make sense of the budgeting process

We interrupt our regularly scheduled programming to talk about… budgeting.

It’s budget season as we head into the fourth quarter of the year, a process which has been equal parts mystifying and demoralizing for me in the past. But there’s hope! With a little bit of financial intelligence under our belts, we science-folk can start to make sense of how this process works.

Let’s take a step back and write out a functional definition of budgeting: What you can afford in the current market conditions given the strategic direction of the business. (credit to my friend Bill King for this one)

Let’s pull that definition apart.

What you can afford depends on your revenue projections and financing— we’ll talk about that a bit more below.

The current market conditions take into account things like interest rate and overall economic climate (we’ll talk a lot about how these factors impact how companies think about internal and external investments later in our series where we discuss ways of evaluating return on investment and something called Net Present Value).

And the strategic direction of the business includes factors like: is this a start-up? Are you positioning your company for sale or scale? Is this business a nice cash cow, but you don’t care much about growth? These factors speak to the phase a company is at as well as the mindset of the leadership/owners. As you will see below, this perspective becomes central to how incremental budget dollars are allocated.

Where to start? Well, before you can set a budget, you need to be able to approximate what growth trajectory your business is on.

Step 1: Revenue projections

So step 1 is to answer the question: what are your revenue projections for the coming year?

For the purposes of illustration, let’s imagine it’s 2021 and we are working on the 2022  budget for our exemplar company, BioTechne.

Screenshot of a budget summary from the BioTechne

Of course, knowing what happened in 2022 is quite handy here, so we can project with absolute confidence something like 20% top line growth in 2022. While it’s good to know the future for the sake of our example, of course normally you’d be forecasting based on past trends and current information about the market and business you are in.

Step 2: Gross margin percentage

Step 2 is to calculate the gross margin percent. In this case, it is a pretty consistent ~68%. Now if you knew you had a major product improvement aimed at improving margin in the coming year, you probably want to take that into account, but here the past was a pretty good predictor of the future, so using the 2021 gross margin percent was pretty spot on for what happened in 2022.

Step 3: Calculate incremental budget

Step 3 is to calculate your total incremental budget. This formula is the Revenue Projection for the coming year minus the revenue for this year, times the gross margin percentage. Here we have the benefit of omniscience, so we can calculate (1,105,599-931,032)*68% =  118,706 as our incremental budget.

Step 4: Allocation

Step 4 is allocation, which really comes down to what management wants to accomplish in the coming year.

  • Let’s say you just finished development of a new product and now you want to really hammer on selling it. In that case, you might allocate most of that incremental budget to sales in the coming year to accomplish that goal.
  • Perhaps you have an ambitious product development agenda for the coming years. Here you might allocate more incremental budget to your R&D team (yay say all the scientists!).
  • Or maybe you know that your product volume is increasing, for instance, in your clinical testing lab. In this case, investments may be needed either on the operations front to directly support that increase (headcount, equipment, etc) or on the R&D front to create workflows that will scale to support the increased testing volume.
  • Lastly, you may have objectives around returning money to shareholders, reaching profitability, or stockpiling money for an impending recession. In these cases, you may choose to not incrementally increase any department’s budget beyond what is absolutely necessary, in order to create shareholder value (higher investor confidence, leads to higher valuations and access to capital).

Of course, all of this illustration was done in the happy scenario of a growing company. If your company is on a downward trajectory, then the math gets inverted. Whose budget is being cut and by how much? Unfortunately, this scenario is all too common this year.

Making sense of ‘mismatched’ budgets

And there is a good perspective to be gleaned for scientific leaders in our current economic reality. We all love to see our teams grow; in good times and bad, most of us feel like we don’t have quite enough resources to accomplish everything we want. However, every new headcount we ask for should be carefully considered. In hiring, we are making a commitment to another person, to their career, and their future. We have a responsibility to these potential new hires and our existing teams to not get too far out over our proverbial skis— the budget has to bear the new headcount this year and in years to come. We need to take a longer view than the resource constraint we see in front of us, and ask ‘can we make this long term commitment at this point?’ and ‘how else might we meet the resource need in front of us?’

At a very high level, that’s the gist of budgeting: figure out what you can afford in the current market conditions given the strategic direction of the business, and allocate it on things that advance your key objectives for the year. So next time your department does not get the budget you were expecting, use it as an opportunity for understanding an alignment: ask how the allocation makes sense given how the company is doing financially and what the company is trying to accomplish in the coming year. Getting clarity on those two things will almost certainly help you be more effective in leading a scientific function.

In the next post, we’ll get back to our regularly scheduled programming and discuss key financial ratios and why they are important.

Illustration of a scientist looking at three pipes with money pouring out of them at different rates, representing different aspects of a cash flow statement

The Anatomy of a Cash Flow Statement: Operating, Investing, and Financing

Recall from last time the cash flow statement from BioTechne, and the three main sections.

  1. The first part describes cash flow from operating activities.
  2. The second part is cash flow from investing activities.
  3. The third part is cash flow from financing activities.

Screenshot of the BioTechne Cash Flow Statement

Let’s take these sections one by one.

Operating Activities

As is typical, the first part of the BioTechne cash flow statement describes cash flow from operating activities.

This is the cash the business collected from customers, minus all the cash that was left as any part of the process of producing goods or delivering services for customers. Many consider this category to be the single most important number for understanding the health of the business, because it signals how well the company is doing at turning profits into cash.

In our current economy, many biotech companies are dreaming about having a healthy operating cash flow. This is because a healthy operating cash flow means that further company growth can be internally funded, instead of needing to borrow or sell stock. And when interest rates are high and stock prices are low, external funding options are not particularly attractive.

Investing Activities

The second part is cash flow from investing activities.

Here we find available-for-sale investments, additions to property and equipment, and acquisitions. This section tells us something about how much cash the company is spending on investing for the future. If this number is low relative to the size of the company, then management may be treating the company as a ‘cash cow’ or potentially positioning itself for an acquisition. If the number is high, the company likely has high hopes for the future.

Let’s briefly compare BioTechne to Beckton Dickenson and Illumina on this front by making up a ratio so we can normalize by company size: cash flow from investing (amount spent in investing, so this is actually a negative number)/net income. For BioTechne in 2023, this ratio is 260,893,000/ 835,382,000 = 0.31, this is considerably higher relative to the previous year: 78,281,000/817,371,000 = 0.096. For BD, we get 3,220,000,000/18,870,000,000 = 0.17. For Illumina, 591,000,000/4,584,000,000 = 0.12. In the case of BioTechne in 2023, we see a big investment in Wilson Wolf, a manufacturing firm that invents, designs, and manufactures innovative cell culture devices and associated ancillary products, which accounted for almost 90% of the total investments.

Financing Activities

The third part is cash flow from financing activities.

This is where we find the cash transfers involving the owners or creditors of the business. We see debt repayment, new debt, share repurchases or issues, dividend payments, etc., all here. This category is where we can see the extent to which the company is dependent on outside financing. A positive number here indicates that cash has come into the company through financing activities. A negative figure here indicates when the company has paid out capital, such as retiring or paying off long-term debt or making a dividend payment to shareholders.

For BioTechne, comparing the last couple years is pretty interesting: in 2022 BioTechne used $177,125,000 in financing activities (repurchasing common stock and paying off long-term debt), whereas in 2023, 46,838,000 was provided by financing activities (cash coming into the business, primarily through a line of credit agreement worth 619,661,000, while also paying off long-term debt).

I was a little curious about this part, so I dug around in the footnotes and found this statement:

“In October 2018, the Company entered into forward starting swaps designated as cash flow hedges on outstanding debt. The forward starting swaps reduce the variability of cash flow payments for the Company by converting the variable interest rate on the Company’s long-term debt described in Note 6 to that of a fixed interest rate. … In May 2021, the Company entered into a new forward starting swap designated as a cash flow hedge on forecasted debt. The forward starting swap reduces the variability of cash flow payments for the Company by converting the variable interest rate on the Company’s forecasted variable interest long-term debt to that of a fixed interest rate.”

Aren’t footnotes fun? 😉

Summary Section

After the cash flow from financing activities, you can see a summary section:

Screenshot of a summary from the BioTechne Cash Flow Statement

One interesting thing to notice here is the first line, ‘Effect of exchange rate changes on cash and cash equivalents.’ If you recall from our very first substantive post on finding financial statements using EDGAR and its utility in learning a new-to-you business, BioTechne listed international exchange rates (the price of one currency expressed in terms of another currency) as one of their financial risks, as is fairly typical in the Life Sciences. Let’s dig into this topic a bit further here.

Whenever a company from one country does business in another, the financial health of its operations will be affected by changes in exchange rates. Let’s say you buy 96-well plates from China, at a price of $0.50 USD per plate, and you are buying ~200,000/month, for a total of $100K transacted per month. With an exchange rate of ~$1 USD for 7 Chinese Yuan, you are paying 700K Yuan for these plates, or 3.5 Yuan per plate. Now let’s imagine the exchange rate changes to $1 USD = 7.5 Chinese Yuan. Each plate still costs 3.5 Yuan, but you now need only $0.47 USD for each plate, meaning your monthly order just got cheaper by ~$7K USD. The opposite situation, where the Yuan becomes stronger against the dollar as it did in the beginning of 2022, will lead to your monthly order costs effectively going up. This example is pretty simplistic, but hopefully it provides a sense of why exchange rates are important for companies with global supply chains.

And that concludes our consideration of the cash flow statement, and wraps up our dive into the three main financial statements (income statement, balance sheet, and cash flow statement).

In the next post, we’ll move on to touch on key financial ratios and why they are important. It’s not too late to join the mailing list to receive an update when it’s published!

Navigating a company’s financial condition with the cash flow statement

“Cash is king,” or so they say. Let’s see how this plays out in the Cash Flow Statement.

We’ve already covered two of the three foundational financial statements— the balance sheet and the income statement.

The balance sheet told us about what the business owns, and what it owes. We use that information to understand the potential to create value for customers.

The income statement told us about the profitability of the business, or how much it costs to generate each dollar of revenue.

Let’s now turn to the third and final foundational financial statement.

The Cash Flow Statement

The cash flow statement is a recording of all the cash that entered and left the business over a period of time. It’s also the financial statement least subject to biases that creep in due to assumptions and estimates. The famous investor Warren Buffet is known to put the greatest emphasis on the cash flow statement when he examines financial statements, paying particular attention to ‘owner earnings.’  The owner earnings (also known as “Free Cash Flow”) can be calculated directly from the cash flow statement by finding the difference between the operating activities and the capital expenditures (i.e., the cash flow from investing activities).

The cash flow statement can provide insight into the financial health and status of an organization.

Specifically, by looking at the cash flow statement, we can answer the following kinds of questions:

  • What is the liquidity situation of the company (i.e., what can be readily converted to cash)?
  • What are the company’s sources of cash?
  • Is there free cash flow being generated to further invest in assets or operations?
  • Is the overall cash increasing or decreasing? How stable is it across different time frames?

The cash flow statement has an important structure. Below is the cash flow statement for BioTechne:

Screenshot of the BioTechne Cash Flow Statement

You can see in this example that there are three sections.

  1. The first part describes cash flow from operating activities— cash flow that’s generated once the company delivers its regular goods or services
  2. The second part is cash flow from investing activities— cash flow from purchasing or selling assets (both physical and non-physical property) using cash, not debt (sometimes referred to as capital expenditures)
  3. The third part is cash flow from financing activities— cash flow from both debt and equity financing

Finally, there is a summary section at the bottom that looks like this:

Screenshot of a summary from the BioTechne Cash Flow Statement

This section tells us whether BioTechne is cash flow positive or negative in the ‘Net change in cash and cash equivalents’ line. So in both 2022 and 2023, BioTechne was cash flow negative, meaning the cash outflow was higher than the cash inflow during that period.

Cash flow vs. profit

Negative cash flow doesn’t necessarily mean profit is lost. Instead, negative cash flow may be caused by a company’s decision to expand the business and invest in future growth. It can also indicate an expenditure and income mismatch, which should be addressed as soon as possible.  Similarly, positive cash flow, while ideal, does not necessarily translate to profit. A business can be profitable without being cash flow-positive, and can have positive cash flow without actually making a profit (often through borrowing money).

Here it’s important to remember that profit is typically defined as the balance that remains when all of a business’s operating expenses are subtracted from its revenues, it answers the question: how much money is left over from selling a product after all expenses from producing it have been paid? This is fundamentally a different question than what cash flow answers, which centers more around whether a company has enough liquidity or cash to pay its expenses.

In a nutshell, this is why it’s important to look at financial statements together.

We’ll dig in more to the three sections of the cash flow statement in our next post. Stay tuned with via the mailing list for updates!

Illusration of a scientist examining concepts from the liabilities and equity portions of a financial balance sheet

Decoding Financial Health with Liabilities & Equity from the Balance Sheet

Back to the balance sheet, specifically liabilities and equity.

In the previous post, we mentioned the fundamental equation of accounting:

Assets – Liabilities = Equity

We also walked through an example of assets from the BioTechne balance sheet.

Looking at liabilities

Now, let’s look at Liabilities. Quite simply, liabilities are what a company owes. 

Let’s take a look at BioTeche’s liabilities in their 2022 Balance Sheet.

Screenshot of the Liabilities portion of a Bio-Techne Balance Sheet

Here we see (balance sheet language is in parentheses):

  • The payments owed to the company’s vendors, e.g. service companies, raw material providers, etc. (Trade accounts payable),
  • future payment of employee salaries, benefits, etc. (Salaries, wages, and related accruals),
  • catch-all bucket (Accrued expenses),
  • pre-paid goods and services owed to customers (Contract liabilities),
  • expected taxes owed in the next 12 months (Income taxes payable),
  • lease payments due over the next 12 months (Operating lease liabilities- current),
  • expected near-term conditional payments that were agreed upon during an acquisition (Contingent consideration payable),
  • the amount of loans that due this year (Current portion of long-term debt obligations),
  • …and so on…

Just like the asset section, you can see there are two chunks of numbers for liabilities.

Any liabilities that require us to part with cash in a year or less are “current liabilities”. If we expect our cash outlay to come over a year in the future, we are dealing with “noncurrent liabilities”.

Equity in the equation

Now we get to equity.

Owners’ equity as what’s left over once you subtract liabilities from assets. It includes the capital provided by investors and the profits retained by the company over time. As you can see in the BioTechne balance sheet below, equity is referred to as ‘Shareholders’ equity,’ which is common, as is ‘Stockholders’ equity.’

Here’s what the equity portion of the BioTechne balance sheet looks like:

Screenshot of the Equities portion of a Bio-Techne Balance Sheet

The big picture from the balance sheet

We’ll close our introductory balance sheet conversation with a quick zoom out on how to use the balance sheet to evaluate a company’s financial health.

  • Is the company solvent? Is equity a positive number?
    • for BioTechne, the answer is yes
  • Can the company pay its bills? How do the current cash assets compare with liabilities?
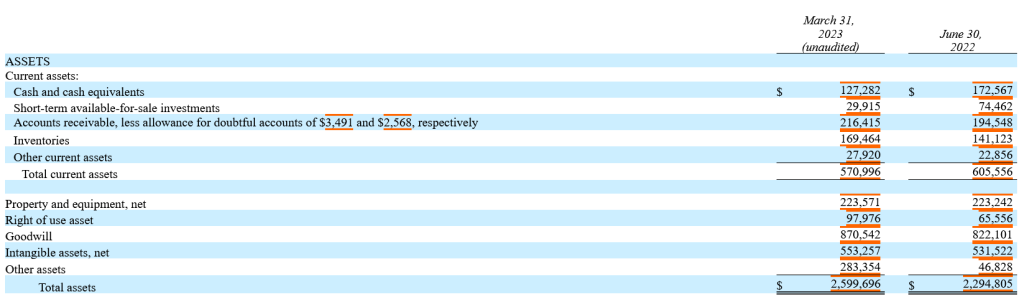
    • cash for BioTechne is at ~$127M and current total liabilities are at ~$141M, which looks bad at first glance, until you notice that there are $217M in accounts receivable, so BioTechne seems quite likely to be able to pay its bills
  • Is the financial health of the company moving in the right direction? Is the equity increasing over time?
    • for BioTeche, this is a yes

You can quickly get answers to these very basic questions from the balance sheet. Investors and other interested parties can also dig deeper to get a more complete picture of a company’s financial health and prospects through the balance sheet, the ever-important footnotes, and careful comparisons to other financial statements.

A few deeper questions to consider: how important is ‘goodwill’ to the company’s total assets line? What assumptions have been used in depreciation and amortization? Is equity rising because the company is making money or because of an inflow of capital?

Let’s quickly look at goodwill for our BioTechne example. In 2023, goodwill accounts for just over 30% of BioTechne’s total assets, which seems pretty hefty. But for our comparator, Becton Dickenson, goodwill is nearly half of its total assets in 2023. For Illumina in 2023, it was ~25%, down from 46% in the previous year (interesting to dig into why, but that will have to wait for another day).

I hope you see how much we can learn about a company just by studying its balance sheet. We get real insights into its viability, and the tools available for future growth.

In the next part, we’ll move into the wonderful world of cash flow. Sign up for the mailing list so to stay updated!

Illustration of a scientist reviewing symbolic representations of company assets, like invoices, equipment and real estate

Assets: tangible, intangible, and goodwill

Let’s talk about balance sheet structure, starting with a focus on Assets.

Below is the balance sheet for our exemplar company, BioTechne:

Screenshot of Bio-Techne Balance Sheet

The first part of the balance sheet is a list of the company’s assets, shown below:

Screenshot of the Assets portion of a Bio-Techne Balance Sheet

Assets are what the company owns: cash and securities, equipment, inventory, intellectual property (IP), real estate, ‘goodwill’ (stay tuned), anything a company could use to create economic value for its customers.

Life science asset examples

Now let’s steer this toward life sciences— what kind of assets would a life sciences company have?

Taking a look at the BioTechne balance sheet, we see (balance sheet language is in parentheses):

  • cash on hand (cash and cash equivalents),
  • inventory ready to sell (short-term available-for-sale investments),
  • cash they’re owed from customers (accounts receivable),
  • inventory that is either raw materials or in the process of being made, or products ready for sale (inventories),
  • physical assets the company owns (property and equipment, net),
  • assets the company is leasing (Right of use asset),
  • difference between the physical assets of an acquired company and what the acquiring company paid; reputation, customer base, and other so on- see below (Goodwill),
  • non-physical assets like employees skills, customer lists and relationships, proprietary knowledge, patents, reputation, data, etc. (intangible assets),
  • anything else the company owns (other assets),

In the balance sheet asset section, you can see there are two chunks of numbers.

If assets are either cash, or we expect to turn them into cash in a year or less, then we call them “current assets”. These are in the first block of figures.

If, however, the assets will not turn into cash in a year or less, they are called “noncurrent assets”, although they are not called out as such in the BioTechne balance sheet.

Clearly cash and cash equivalents are already cash. They’re current assets.

Accounts receivable, or the cash we’re owed from our customers, are current assets. We expect to collect that cash within a year.

Likewise inventories, the stuff we have on shelves, are current assets, since we expect to sell it and collect within a year.

On the other hand, property and equipment, goodwill, and intangible assets will not be monetized within a year, so it’s a noncurrent asset.

Making sense of balance sheet’s ‘Goodwill’ assets

Before we move on to liabilities and equity, let’s talk about Goodwill and Intangible Assets (which includes IP generated by R&D).

Goodwill can be defined as “difference between the physical assets of an acquired company and what the acquiring company paid; reputation, customer base, and other so on.”

Let’s give this definition a little more concreteness with a hypothetical example, shall we? We know from reading other parts of the 10-K that BioTechne acquired Exosome Diagnostics in 2018. A little digging reveals that BioTechne paid $250 million in cash plus contingent consideration of up to $325 million due upon the achievement of certain future milestones. When this happened, the asset called ‘cash’ decreased by $250M, and, in order for the balance sheet to balance, all other assets have to rise by $250M; so far nothing has happened that would change liabilities or owners’ equity.

So what assets increase? Well, you have the physical assets that BioTechne got with this acquisition— physical things that can be sold. Maybe some lab equipment, servers or other computer equipment, perhaps even the physical lab space. These assets are not likely to constitute the bulk of the $250M cash up-front that BioTechne paid. In fact, the CEO at the time said, ““ExosomeDx’s technology is a game changer and positions Bio-Techne to be a leader in the rapidly growing noninvasive liquid biopsy market.” And a Fierce Biotech article at the time stated, “With the deal, Bio-Techne is also getting about 200 of Exosome’s filed patents and applications of technology focused on new diagnostics in various pathologies with either difficult or no current diagnostic solutions, such as prostate, bladder, kidney, breast, glioblastoma and other cancers.” In other words, quite a lot of the value the BioTechne expected to get out of the ExosomeDx acquisition (at least publicly) was in (1) market positioning and (2) intellectual property, proprietary knowledge, and employee skills. Except for the patents, which could potentially be sold, these items fall into the bucket of ‘Goodwill.’

As you are probably gathering, goodwill is a bit squishy and too much of it on a balance sheet is probably a signal to be a bit wary. This is particularly true as goodwill is not amortized, so unlike the physical items gained in the acquisitions, which will depreciate over time, goodwill assets will continue to sit on the books.

IP, patents, and other intangible assets are an important aspect of the balance sheet for anyone leading an R&D organization to understand. Consider: how do you account for the cost of creating a new asset, like a reagent kit or clinical assay, that you expect to generate revenue for years to come? Just like we saw with depreciation in the income statement section, you don’t record the whole cost upfront, as it will generate revenue over time (remember in the income statement you are trying to abide by the ‘Matching Principle’). If you choose to amortize your R&D, then your assets and profitability will look better in the short term (just like the example of depreciation we worked through in a previous section). A more conservative approach is to expense R&D as it is incurred. So as we saw with depreciation in physical assets, there is room for shenanigans with intangible assets as well that impact both equity on the balance sheet and profitability on the income statement.

In the next part of this series, we’ll cover the liabilities and equity side of the balance sheet. You can sign up here to join the mailing list so you don’t miss it.

Illustration of various elements of a balance sheet, such as patents, cash and due invoices, sitting in balance on a seesaw

Using the Balance Sheet to Understand a Company’s Financial Health

To review, the big three in terms of financial statements are:

  • the income statement,
  • the balance sheet, and
  • the cash flow statement.

In this post, we will talk about the importance of a balance sheet.

Remember that a balance sheet tells us what a company owns, i.e. its assets, versus what it owes, i.e. its liabilities.

Equity measures the extent to which assets exceed liabilities, and is what “belongs” to the owners of the company.

Assets and liabilities are connected with equity via the fundamental equation of accounting:

Assets – Liabilities = Equity

Why do we care about balance sheets?

First, healthy companies have more assets than liabilities. And looking at how assets, liabilities, and equity have trended over time helps us understand whether a company is getting healthier or sicker.

Profitability (discussed in the income statement section) relates to equity, in the same way a grade in college relates to your overall GPA. You can think of profitability sort of like a single course grade, whereas equity is more like your grade point average. A single course grade will influence your GPA, but it doesn’t define it. Similarly, a strong quarter of profits will increase the equity in your balance sheet, and vice versa. Over time, the equity reflects the accumulation of profits and losses.

Second, balance sheets tell us about leverage (here’s a fun vocabulary lesson for you: a financial analyst’s word for debt is leverage). How much debt does the company rely on?

The higher the debt load, the higher the company’s debt service costs, which reduces its ability to invest or spend in other ways.

Balance sheet takeaways

These are the kinds of questions about a company’s financial health that you can answer with the balance sheet:

  • How much debt does the company have relative to equity?
  • How liquid is the business in the short term (less than one year)- can it pay its bills?
  • What percentage of assets are tangible and what percentage comes from financial transactions?
  • Is the financial health of the company moving in the right direction- is the equity increasing over time?

Short post for today, but next time we’ll dig into the first part of the balance sheet: Assets, including a particularly interesting asset category called ‘Goodwill.’

Page 1 of 2

Powered by WordPress & Theme by Anders Norén