Leadership in Biotech

Tag: balance sheet

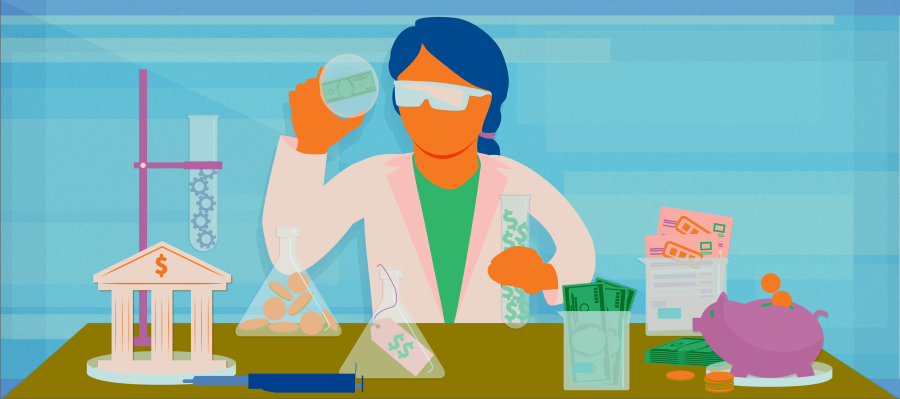
Illusration of a scientist examining concepts from the liabilities and equity portions of a financial balance sheet

Decoding Financial Health with Liabilities & Equity from the Balance Sheet

Back to the balance sheet, specifically liabilities and equity.

In the previous post, we mentioned the fundamental equation of accounting:

Assets – Liabilities = Equity

We also walked through an example of assets from the BioTechne balance sheet.

Looking at liabilities

Now, let’s look at Liabilities. Quite simply, liabilities are what a company owes. 

Let’s take a look at BioTeche’s liabilities in their 2022 Balance Sheet.

Screenshot of the Liabilities portion of a Bio-Techne Balance Sheet

Here we see (balance sheet language is in parentheses):

  • The payments owed to the company’s vendors, e.g. service companies, raw material providers, etc. (Trade accounts payable),
  • future payment of employee salaries, benefits, etc. (Salaries, wages, and related accruals),
  • catch-all bucket (Accrued expenses),
  • pre-paid goods and services owed to customers (Contract liabilities),
  • expected taxes owed in the next 12 months (Income taxes payable),
  • lease payments due over the next 12 months (Operating lease liabilities- current),
  • expected near-term conditional payments that were agreed upon during an acquisition (Contingent consideration payable),
  • the amount of loans that due this year (Current portion of long-term debt obligations),
  • …and so on…

Just like the asset section, you can see there are two chunks of numbers for liabilities.

Any liabilities that require us to part with cash in a year or less are “current liabilities”. If we expect our cash outlay to come over a year in the future, we are dealing with “noncurrent liabilities”.

Equity in the equation

Now we get to equity.

Owners’ equity as what’s left over once you subtract liabilities from assets. It includes the capital provided by investors and the profits retained by the company over time. As you can see in the BioTechne balance sheet below, equity is referred to as ‘Shareholders’ equity,’ which is common, as is ‘Stockholders’ equity.’

Here’s what the equity portion of the BioTechne balance sheet looks like:

Screenshot of the Equities portion of a Bio-Techne Balance Sheet

The big picture from the balance sheet

We’ll close our introductory balance sheet conversation with a quick zoom out on how to use the balance sheet to evaluate a company’s financial health.

  • Is the company solvent? Is equity a positive number?
    • for BioTechne, the answer is yes
  • Can the company pay its bills? How do the current cash assets compare with liabilities?
    • cash for BioTechne is at ~$127M and current total liabilities are at ~$141M, which looks bad at first glance, until you notice that there are $217M in accounts receivable, so BioTechne seems quite likely to be able to pay its bills
  • Is the financial health of the company moving in the right direction? Is the equity increasing over time?
    • for BioTeche, this is a yes

You can quickly get answers to these very basic questions from the balance sheet. Investors and other interested parties can also dig deeper to get a more complete picture of a company’s financial health and prospects through the balance sheet, the ever-important footnotes, and careful comparisons to other financial statements.

A few deeper questions to consider: how important is ‘goodwill’ to the company’s total assets line? What assumptions have been used in depreciation and amortization? Is equity rising because the company is making money or because of an inflow of capital?

Let’s quickly look at goodwill for our BioTechne example. In 2023, goodwill accounts for just over 30% of BioTechne’s total assets, which seems pretty hefty. But for our comparator, Becton Dickenson, goodwill is nearly half of its total assets in 2023. For Illumina in 2023, it was ~25%, down from 46% in the previous year (interesting to dig into why, but that will have to wait for another day).

I hope you see how much we can learn about a company just by studying its balance sheet. We get real insights into its viability, and the tools available for future growth.

In the next part, we’ll move into the wonderful world of cash flow. Sign up for the mailing list so to stay updated!

Illustration of a scientist reviewing symbolic representations of company assets, like invoices, equipment and real estate

Assets: tangible, intangible, and goodwill

Let’s talk about balance sheet structure, starting with a focus on Assets.

Below is the balance sheet for our exemplar company, BioTechne:

Screenshot of Bio-Techne Balance Sheet

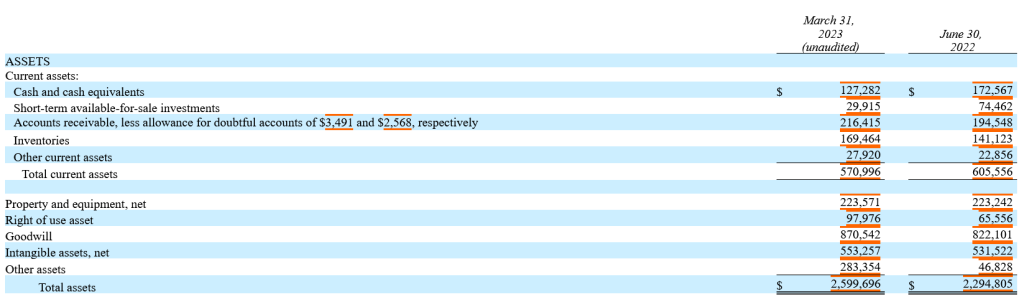
The first part of the balance sheet is a list of the company’s assets, shown below:

Screenshot of the Assets portion of a Bio-Techne Balance Sheet

Assets are what the company owns: cash and securities, equipment, inventory, intellectual property (IP), real estate, ‘goodwill’ (stay tuned), anything a company could use to create economic value for its customers.

Life science asset examples

Now let’s steer this toward life sciences— what kind of assets would a life sciences company have?

Taking a look at the BioTechne balance sheet, we see (balance sheet language is in parentheses):

  • cash on hand (cash and cash equivalents),
  • inventory ready to sell (short-term available-for-sale investments),
  • cash they’re owed from customers (accounts receivable),
  • inventory that is either raw materials or in the process of being made, or products ready for sale (inventories),
  • physical assets the company owns (property and equipment, net),
  • assets the company is leasing (Right of use asset),
  • difference between the physical assets of an acquired company and what the acquiring company paid; reputation, customer base, and other so on- see below (Goodwill),
  • non-physical assets like employees skills, customer lists and relationships, proprietary knowledge, patents, reputation, data, etc. (intangible assets),
  • anything else the company owns (other assets),

In the balance sheet asset section, you can see there are two chunks of numbers.

If assets are either cash, or we expect to turn them into cash in a year or less, then we call them “current assets”. These are in the first block of figures.

If, however, the assets will not turn into cash in a year or less, they are called “noncurrent assets”, although they are not called out as such in the BioTechne balance sheet.

Clearly cash and cash equivalents are already cash. They’re current assets.

Accounts receivable, or the cash we’re owed from our customers, are current assets. We expect to collect that cash within a year.

Likewise inventories, the stuff we have on shelves, are current assets, since we expect to sell it and collect within a year.

On the other hand, property and equipment, goodwill, and intangible assets will not be monetized within a year, so it’s a noncurrent asset.

Making sense of balance sheet’s ‘Goodwill’ assets

Before we move on to liabilities and equity, let’s talk about Goodwill and Intangible Assets (which includes IP generated by R&D).

Goodwill can be defined as “difference between the physical assets of an acquired company and what the acquiring company paid; reputation, customer base, and other so on.”

Let’s give this definition a little more concreteness with a hypothetical example, shall we? We know from reading other parts of the 10-K that BioTechne acquired Exosome Diagnostics in 2018. A little digging reveals that BioTechne paid $250 million in cash plus contingent consideration of up to $325 million due upon the achievement of certain future milestones. When this happened, the asset called ‘cash’ decreased by $250M, and, in order for the balance sheet to balance, all other assets have to rise by $250M; so far nothing has happened that would change liabilities or owners’ equity.

So what assets increase? Well, you have the physical assets that BioTechne got with this acquisition— physical things that can be sold. Maybe some lab equipment, servers or other computer equipment, perhaps even the physical lab space. These assets are not likely to constitute the bulk of the $250M cash up-front that BioTechne paid. In fact, the CEO at the time said, ““ExosomeDx’s technology is a game changer and positions Bio-Techne to be a leader in the rapidly growing noninvasive liquid biopsy market.” And a Fierce Biotech article at the time stated, “With the deal, Bio-Techne is also getting about 200 of Exosome’s filed patents and applications of technology focused on new diagnostics in various pathologies with either difficult or no current diagnostic solutions, such as prostate, bladder, kidney, breast, glioblastoma and other cancers.” In other words, quite a lot of the value the BioTechne expected to get out of the ExosomeDx acquisition (at least publicly) was in (1) market positioning and (2) intellectual property, proprietary knowledge, and employee skills. Except for the patents, which could potentially be sold, these items fall into the bucket of ‘Goodwill.’

As you are probably gathering, goodwill is a bit squishy and too much of it on a balance sheet is probably a signal to be a bit wary. This is particularly true as goodwill is not amortized, so unlike the physical items gained in the acquisitions, which will depreciate over time, goodwill assets will continue to sit on the books.

IP, patents, and other intangible assets are an important aspect of the balance sheet for anyone leading an R&D organization to understand. Consider: how do you account for the cost of creating a new asset, like a reagent kit or clinical assay, that you expect to generate revenue for years to come? Just like we saw with depreciation in the income statement section, you don’t record the whole cost upfront, as it will generate revenue over time (remember in the income statement you are trying to abide by the ‘Matching Principle’). If you choose to amortize your R&D, then your assets and profitability will look better in the short term (just like the example of depreciation we worked through in a previous section). A more conservative approach is to expense R&D as it is incurred. So as we saw with depreciation in physical assets, there is room for shenanigans with intangible assets as well that impact both equity on the balance sheet and profitability on the income statement.

In the next part of this series, we’ll cover the liabilities and equity side of the balance sheet. You can sign up here to join the mailing list so you don’t miss it.

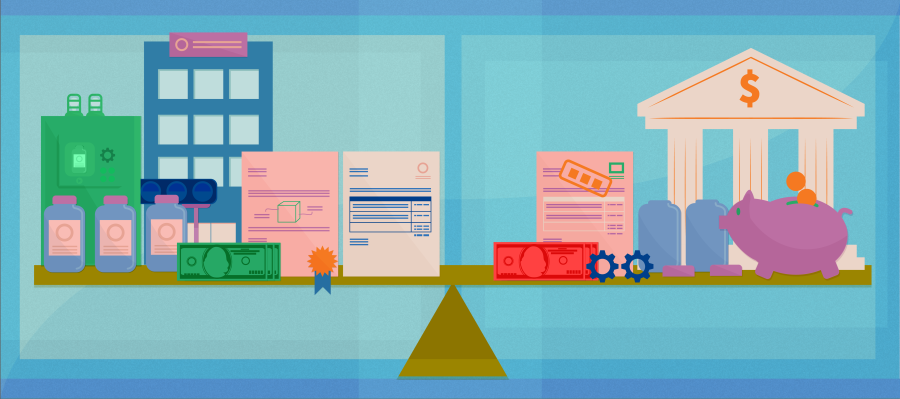
Illustration of various elements of a balance sheet, such as patents, cash and due invoices, sitting in balance on a seesaw

Using the Balance Sheet to Understand a Company’s Financial Health

To review, the big three in terms of financial statements are:

  • the income statement,
  • the balance sheet, and
  • the cash flow statement.

In this post, we will talk about the importance of a balance sheet.

Remember that a balance sheet tells us what a company owns, i.e. its assets, versus what it owes, i.e. its liabilities.

Equity measures the extent to which assets exceed liabilities, and is what “belongs” to the owners of the company.

Assets and liabilities are connected with equity via the fundamental equation of accounting:

Assets – Liabilities = Equity

Why do we care about balance sheets?

First, healthy companies have more assets than liabilities. And looking at how assets, liabilities, and equity have trended over time helps us understand whether a company is getting healthier or sicker.

Profitability (discussed in the income statement section) relates to equity, in the same way a grade in college relates to your overall GPA. You can think of profitability sort of like a single course grade, whereas equity is more like your grade point average. A single course grade will influence your GPA, but it doesn’t define it. Similarly, a strong quarter of profits will increase the equity in your balance sheet, and vice versa. Over time, the equity reflects the accumulation of profits and losses.

Second, balance sheets tell us about leverage (here’s a fun vocabulary lesson for you: a financial analyst’s word for debt is leverage). How much debt does the company rely on?

The higher the debt load, the higher the company’s debt service costs, which reduces its ability to invest or spend in other ways.

Balance sheet takeaways

These are the kinds of questions about a company’s financial health that you can answer with the balance sheet:

  • How much debt does the company have relative to equity?
  • How liquid is the business in the short term (less than one year)- can it pay its bills?
  • What percentage of assets are tangible and what percentage comes from financial transactions?
  • Is the financial health of the company moving in the right direction- is the equity increasing over time?

Short post for today, but next time we’ll dig into the first part of the balance sheet: Assets, including a particularly interesting asset category called ‘Goodwill.’

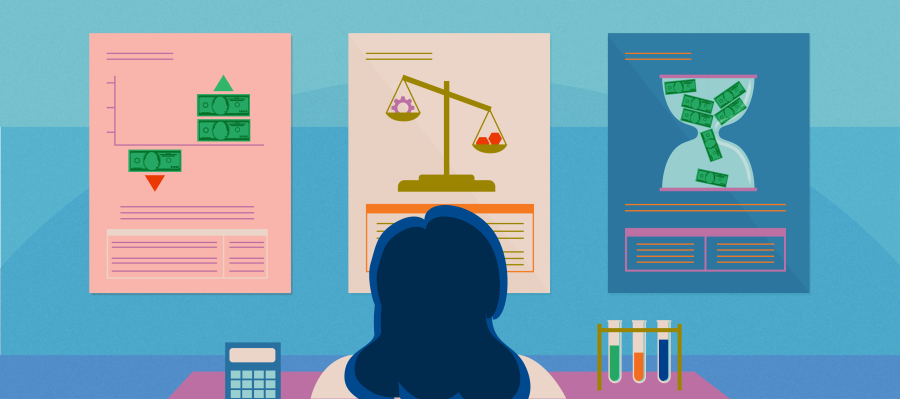
Stylized illustration of a scientist examining an income statement, a balance sheet, and a cash flow statement

Every scientist’s dream: Understanding financial statements

Every company that trades on the stock market has to share their financial results every three months, i.e., quarterly. Once a year, they produce an annual report, which is basically a blown out version of these quarterly documents.. You know those “10-K (annual reports) and 10-Q (quarterly reports)” we found for Bio-Techne on EDGAR? That’s what I’m talking about. 🙂

There’s quite a bit you can learn from these documents, but here we will focus on the financial statements.

The main statements are

  • the income statement,
  • the balance sheet, and
  • the cash flow statement.

These statements are not just for life sciences companies. All companies that trade on the stock market are required to file these documents. Nonprofit organizations and government agencies use similar statements, although there are a few key differences we won’t cover here.

The income statement shows us how much money the company makes. This statement matches the expenses with the revenue, so one can see how efficient the company is at making money.

The balance sheet shows us what the company has (i.e. its assets) and what it owes (i.e. its liabilities). The difference between assets and liabilities is equity, the part that belongs to the owners/shareholders of the company.

The cash flow statement simply tracks how much money is coming in and going out of the business over a period of time. As soon as money moves in or out, the cash flow result is recorded.

Putting together the full picture

These three statements together give us a clear picture of how well the company is doing financially. Of course, there’s considerable nuance in how a company approaches these statements that can impact how well or poorly it looks like it’s doing. There are rules governing accounting and finance, but there’s also quite a bit of art to it, and when companies get too creative or allow significant bias to creep in based on market pressure, that’s where you start to head towards fraud and financial ruin. We’ll cover that along the way, too.

One way to think about accounting is similar to the way you would run a scientific experiment – In an experiment you have controls – to measure the result vs a comparison point.  One of the most fundamental accounting rules for GAAP (Generally Accepted Accounting Principles) is that GAAP is consistently applied- so you have a control in place and can do valid comparisons between quarters, years and months, just like a good trial or experiment.

These financial statements are the gold mine of information that stock analysts use to figure out how much these companies are worth, and what their stock price should be.

While stock analysts also look at other data outside of these basic financial statements, even if you only had the data in these statements, you’d have a strong understanding of the company’s past performance and current state. And from there, with some insight into the market that the company operates in, you can start to make some predictions about the future.

In the next part, we’ll explore the income statement. We’ll go through the structure of it, then we’ll look at some real world examples.

Stay tuned! (Which is easier if you join my mailing list to be updated when the next installment comes out.)

Powered by WordPress & Theme by Anders Norén