
Leadership in Biotech

Tag: business

Illustration of a scientist looking at three pipes with money pouring out of them at different rates, representing different aspects of a cash flow statement

The Anatomy of a Cash Flow Statement: Operating, Investing, and Financing

Recall from last time the cash flow statement from BioTechne, and the three main sections.

  1. The first part describes cash flow from operating activities.
  2. The second part is cash flow from investing activities.
  3. The third part is cash flow from financing activities.

Screenshot of the BioTechne Cash Flow Statement

Let’s take these sections one by one.

Operating Activities

As is typical, the first part of the BioTechne cash flow statement describes cash flow from operating activities.

This is the cash the business collected from customers, minus all the cash that was left as any part of the process of producing goods or delivering services for customers. Many consider this category to be the single most important number for understanding the health of the business, because it signals how well the company is doing at turning profits into cash.

In our current economy, many biotech companies are dreaming about having a healthy operating cash flow. This is because a healthy operating cash flow means that further company growth can be internally funded, instead of needing to borrow or sell stock. And when interest rates are high and stock prices are low, external funding options are not particularly attractive.

Investing Activities

The second part is cash flow from investing activities.

Here we find available-for-sale investments, additions to property and equipment, and acquisitions. This section tells us something about how much cash the company is spending on investing for the future. If this number is low relative to the size of the company, then management may be treating the company as a ‘cash cow’ or potentially positioning itself for an acquisition. If the number is high, the company likely has high hopes for the future.

Let’s briefly compare BioTechne to Beckton Dickenson and Illumina on this front by making up a ratio so we can normalize by company size: cash flow from investing (amount spent in investing, so this is actually a negative number)/net income. For BioTechne in 2023, this ratio is 260,893,000/ 835,382,000 = 0.31, this is considerably higher relative to the previous year: 78,281,000/817,371,000 = 0.096. For BD, we get 3,220,000,000/18,870,000,000 = 0.17. For Illumina, 591,000,000/4,584,000,000 = 0.12. In the case of BioTechne in 2023, we see a big investment in Wilson Wolf, a manufacturing firm that invents, designs, and manufactures innovative cell culture devices and associated ancillary products, which accounted for almost 90% of the total investments.

Financing Activities

The third part is cash flow from financing activities.

This is where we find the cash transfers involving the owners or creditors of the business. We see debt repayment, new debt, share repurchases or issues, dividend payments, etc., all here. This category is where we can see the extent to which the company is dependent on outside financing. A positive number here indicates that cash has come into the company through financing activities. A negative figure here indicates when the company has paid out capital, such as retiring or paying off long-term debt or making a dividend payment to shareholders.

For BioTechne, comparing the last couple years is pretty interesting: in 2022 BioTechne used $177,125,000 in financing activities (repurchasing common stock and paying off long-term debt), whereas in 2023, 46,838,000 was provided by financing activities (cash coming into the business, primarily through a line of credit agreement worth 619,661,000, while also paying off long-term debt).

I was a little curious about this part, so I dug around in the footnotes and found this statement:

“In October 2018, the Company entered into forward starting swaps designated as cash flow hedges on outstanding debt. The forward starting swaps reduce the variability of cash flow payments for the Company by converting the variable interest rate on the Company’s long-term debt described in Note 6 to that of a fixed interest rate. … In May 2021, the Company entered into a new forward starting swap designated as a cash flow hedge on forecasted debt. The forward starting swap reduces the variability of cash flow payments for the Company by converting the variable interest rate on the Company’s forecasted variable interest long-term debt to that of a fixed interest rate.”

Aren’t footnotes fun? 😉

Summary Section

After the cash flow from financing activities, you can see a summary section:

Screenshot of a summary from the BioTechne Cash Flow Statement

One interesting thing to notice here is the first line, ‘Effect of exchange rate changes on cash and cash equivalents.’ If you recall from our very first substantive post on finding financial statements using EDGAR and its utility in learning a new-to-you business, BioTechne listed international exchange rates (the price of one currency expressed in terms of another currency) as one of their financial risks, as is fairly typical in the Life Sciences. Let’s dig into this topic a bit further here.

Whenever a company from one country does business in another, the financial health of its operations will be affected by changes in exchange rates. Let’s say you buy 96-well plates from China, at a price of $0.50 USD per plate, and you are buying ~200,000/month, for a total of $100K transacted per month. With an exchange rate of ~$1 USD for 7 Chinese Yuan, you are paying 700K Yuan for these plates, or 3.5 Yuan per plate. Now let’s imagine the exchange rate changes to $1 USD = 7.5 Chinese Yuan. Each plate still costs 3.5 Yuan, but you now need only $0.47 USD for each plate, meaning your monthly order just got cheaper by ~$7K USD. The opposite situation, where the Yuan becomes stronger against the dollar as it did in the beginning of 2022, will lead to your monthly order costs effectively going up. This example is pretty simplistic, but hopefully it provides a sense of why exchange rates are important for companies with global supply chains.

And that concludes our consideration of the cash flow statement, and wraps up our dive into the three main financial statements (income statement, balance sheet, and cash flow statement).

In the next post, we’ll move on to touch on key financial ratios and why they are important. It’s not too late to join the mailing list to receive an update when it’s published!

Illustration of a scientist considering the effects of depreciation on the pipette she is considering buying

How expenses and depreciation can affect the profitability of your scientific work

In this post, we’re continuing our foray into the Income Statement, focusing on expenses. Our dive into expenses will include Research and Development (R&D) expenses, near and dear to any scientist. 

Let’s return once again to the now quite familiar BioTechne Income Statement:

Screenshot of Bio-Techne Income Statement

The second block of items in the Income Statement enumerates Operating Expenses. These are broken down into ‘Sales, General, and Administrative’ (sometimes you see this referred to as SG&A or G&A) and ‘Research and Development.’ Note that the line items here can change depending on the type of business you are in. If sales is a large part of your business, you may choose to have Sales as its own line, and G&A kept separate. Some business sectors may not pull out R&D as a separate line item, but this would be highly unusual for Life Science businesses, as R&D is a crucial part of our business models.

An important aspect of G&A for R&D leaders to understand is depreciation and amortization. How these expenses are handled can GREATLY impact the profit seen in an income statement. And while we’ll talk more about profit in the next section, I do want to pause briefly on the depreciation and amortization handling here.

Depreciation and amortization

First, some definitions. If you are like me, depreciation already feels like a somewhat familiar concept. Depreciation refers to both (1) the decrease in the value of assets over time and (2) the method used to reallocate, or “write down” the cost of a tangible asset (such as equipment) over its useful life span. In accounting, we are referring to the second of those definitions. Amortization is the same basic concept as depreciation, except it applies to intangible assets like patents, copyrights, and trade secrets.

To really understand depreciation and amortization, we need to resurrect ‘The Matching Principle’ referenced in the first post on the income statement. The matching principle seeks to match the cost with its associated revenue to determine profits in a given time period. For instance: you buy a fancy new Illumina Sequencer this year, but the expectation is that it will help to bring in revenue for the next 5+ years, so some percentage of that initial cost of the sequencer needs to be recorded in future income statements. But how long exactly will this sequencer be (1) functional and (2) part of your clinical workflow? What the accountants decide can have a huge impact on the profit in the income statement.

Here’s a worked example. Let’s say you bought a NovaSeqX recently that put you back a cool $1M. Now let’s consider three different ways of approaching depreciation and see how it impacts profit for an imaginary CRO business in which you generate $900K in revenue and incur $500K in direct costs (technician salaries, reagents, etc) and $300K in overhead (rent, marketing, etc) in a given quarter. Scenario 1: we assume the sequencer will last us 5 years, so we depreciate it by $50K per quarter (cost – salvage value) / useful life; for simplicity I am assuming a $0 salvage value). Scenario 2: we assume the sequencer will last us 2 years, which then gives us $125K per quarter depreciation. Scenario 3: we assume we’ll be using this sequencer for the next 10 years, which puts quarterly depreciation at $25K per quarter. In the table below, you can see that in scenario 2, this business is now operating in the red, whereas things look pretty rosy in scenario 3.

(in $1000)Scenario 1Scenario 2Scenario 3
Revenue900900900
Cost of goods sold500500500
Gross Profit400400400
Expenses300300300
Depreciation5012525
Net Profit50-2575

There are two things to take away from this example: (1) profit can be significantly influenced by the assumptions you make in depreciation and amortization and (2) these assumptions should be part of considerations to make significant capital investments. So next time you argue for a capital investment, keep in mind how it will impact your company’s income statement, financial health, and, ultimately, also the stock price.  

In the next part of this series, we’ll take a more complete look at a company’s profitability. In the meantime, you can sign up to the mailing list to be updated when the next installment is out.

A stylized illustration showing how earning revenue is discrete from creating, delivering or even selling products

What scientists need to understand about revenue and its recognition

Today we will talk about revenue.

Revenue seems like a pretty obvious concept: the dollar value of the products and services a company provided to its customers during a given period of time (remember the ‘Matching Principle’ we talked about in the last post?). 

There are some subtleties here, because in order to record something as revenue, it must have been ‘earned.’ If you are selling a reagent, then you must have shipped it to your customer. If you are performing a service, say running a diagnostic test, then you should have performed the work. Easy enough? Sure, but consider:

Say BioTechne allows a customer to order reagents ahead of when they will need them (for instance, maybe the customer is looking to control the number of lots they have), but because this is a particularly important, high volume account, BioTechne is willing to hold those particular lots of reagents until the customer needs them (i.e., you haven’t shipped them yet). When can they recognize that revenue?

Or let’s say the diagnostics side of the business, ExosomeDx, signs a multi-year pharma contract for processing and analysis of clinical samples. When do they get to recognize the revenue from that deal? When the samples are run? Or when the complete analysis is delivered to the client?

Let’s keep these points in mind as we look through the numbers. 

Below is the screenshot of the income statement for BioTechne:

Screenshot of Bio-Techne Income StatementYou have Net Sales, i.e., Revenue, listed at the very top. Yet another place where different terms are used for the same concept. If we look at the income statement of another company in the space, Beckton Dickenson, their top line is called out as Revenue.

Screenshot of Becton, Dickinson and Company Income Statement

When revenue reporting isn’t black and white

As we saw in the examples at the top of this post, there can be a fair amount of nuance in when and how to recognize sales, and tremendous pressure to make this figure look strong. And because of this, the place where the most accounting shenanigans happen is in revenue recognition. In fact, most accounting fraud occurs in the top line, but even non-criminal bias can land a company in hot water. 

A quick example of how (non-criminal) bias can creep in could be around service contracts when an instrument is sold. Let’s say customers purchase a 5-year service contract alongside an instrument. When do you recognize that income? The service at year 0 has not been rendered, so you can’t recognize all the revenue, but you can claim that most of the cost of that service contract has been in making the initial sale, so 75% of the revenue should be recognized up front. Equally legitimate would be to say that only a small percentage of the revenue should be recognized up front, because most of the cost is associated with servicing that machine down the line. It’s really a judgment call that depends on the particularities of the business. 

What’s interesting is that you can even change your revenue recognition strategy, although generally it’s fairly suspicious to be doing this often (remember “consistently applied” from the last post?). If there is a change in revenue recognition strategy, it would be called out in the footnotes— another reason why it’s not a bad idea to look through them. 

Another example of bias and uncertainty in revenue is the quality of the customer.  Will the revenue shipped actually be paid for? Have you given special consideration to the customer (6 months to pay for example)? Have you made promises (warranty) that the product will perform down the road (a product warranty)?  All of these factors can contribute to revenue uncertainty.  

Depending on where in an organization you sit, scientific and technical decisions you make may impact revenue and its recognition. Are you developing a stand-alone product? Is it part of an ongoing delivery schedule? Are other services attached to it? These questions might color the response your work gets from other stakeholders in your company if they’re targeting a particular revenue goal.

Those are the highlights for revenue. In the next two posts, we’ll get into the murky realm of costs and expenses. Make sure you’re on the mailing list so you don’t miss it!

A first look at income statements: revenue, costs and profits

Today we talk about the income statement, possibly the most discussed financial statement.

The income statement attempts to measure whether the products or services that a company provides are profitable when everything gets added up. In other words, how many sales did a company make during a period of time, how much did it cost to make those sales, and what profit is left over.

The income statement can help answer the following questions about a company’s financial health:

  • How much is revenue growing?
  • What is the gross profit margin for sales?
  • What percentage of revenue results in net profit after all expenses?
  • How much does the business repay shareholders versus reinvesting (and what that might mean for how the company sees its future)?

As a quick aside, there’s a fundamental accounting rule called ‘The Matching Principle’ at play in the income statement that is worth mentioning here. Briefly, the matching principle seeks to match the cost with its associated revenue to determine profits in a given time period. This principle will come up throughout the sections about the income statement.

There are always 3 main categories on an income statements:

  • Sales or revenue is at the top (fun fact: when fancy people say ‘top-line growth’ they mean sales growth, because sales is always at the top of the income statement)
  • Costs and expenses are in the middle
  • Profit is at the bottom

Today, we will focus on just identifying how to read these statements.

Parsing the Income Statement

To do that, let’s go back to Bio-Techne and take a look at their annual income statement for 2022 by pulling up the most recent 10-K filing again.

First thing to notice is that it doesn’t say ‘Income Statement.’ Instead, it has this:

Report text: Item 8. Financial Statements and Supplementary Data. Consolidated Statements of Earnings and Comprehensive Income

It can also be called the ‘profit and loss statement’ or ‘P&L statement’ or ‘operating statement’ or ‘statement of operations’ or ‘statement of earnings’ or ‘earnings statement’ or some combination therein, like we have here for our example. Sometimes it feels like those crafty finance people intentionally obfuscate things. 😉

The other things to notice here are that

  • we are looking at the income statement for the Bio-Techne Corporation and Subsidiaries, i.e., the whole company, not one division, and
  • numbers are listed in thousands- sometimes this can be millions, so best to pay attention.

So here it is for Bio-Techne. The Income Statement. Remember, sales or revenue is at the top, costs and expenses are in the middle, profit is at the bottom. We’ll take these each separately in the upcoming posts.

Screenshot of Bio-Techne Income Statement

A note on footnotes

Before we wrap up today, I want to draw your attention to the ‘See Notes to Consolidated Financial Statements’ at the bottom of the Income Statement.

These footnotes are required per the rules of accounting to explain how the totals were arrived at. Remember that the rules of accounting are meant to be applied consistently, so that one can readily compare trends over time. However, it can be perfectly legitimate to modify the approach, and that modification will be called out in the footnotes. So, every now and again there are very interesting nuggets in the footnotes, however, there are usually quite a lot of them.

Here’s an example footnote about inventory basically explaining that they make more than the sales demand due to ‘economies of scale through a highly controlled manufacturing process.’ Those of you who have worked in regulated manufacturing environments on these types of products will know that manufacturing runs or batch sizes are validated at particular amounts/volumes- you can’t just manufacture to whatever volume you want, and that impacts the financial statements:

Screenshot of a footnote concerning inventories from a Bio-Techne Income Statement

That covers the basics. In the next post, we’ll talk about revenue! As always, you can sign up to the mailing list to be updated when the next installment is out.

Stylized illustration of a scientist examining an income statement, a balance sheet, and a cash flow statement

Every scientist’s dream: Understanding financial statements

Every company that trades on the stock market has to share their financial results every three months, i.e., quarterly. Once a year, they produce an annual report, which is basically a blown out version of these quarterly documents.. You know those “10-K (annual reports) and 10-Q (quarterly reports)” we found for Bio-Techne on EDGAR? That’s what I’m talking about. 🙂

There’s quite a bit you can learn from these documents, but here we will focus on the financial statements.

The main statements are

  • the income statement,
  • the balance sheet, and
  • the cash flow statement.

These statements are not just for life sciences companies. All companies that trade on the stock market are required to file these documents. Nonprofit organizations and government agencies use similar statements, although there are a few key differences we won’t cover here.

The income statement shows us how much money the company makes. This statement matches the expenses with the revenue, so one can see how efficient the company is at making money.

The balance sheet shows us what the company has (i.e. its assets) and what it owes (i.e. its liabilities). The difference between assets and liabilities is equity, the part that belongs to the owners/shareholders of the company.

The cash flow statement simply tracks how much money is coming in and going out of the business over a period of time. As soon as money moves in or out, the cash flow result is recorded.

Putting together the full picture

These three statements together give us a clear picture of how well the company is doing financially. Of course, there’s considerable nuance in how a company approaches these statements that can impact how well or poorly it looks like it’s doing. There are rules governing accounting and finance, but there’s also quite a bit of art to it, and when companies get too creative or allow significant bias to creep in based on market pressure, that’s where you start to head towards fraud and financial ruin. We’ll cover that along the way, too.

One way to think about accounting is similar to the way you would run a scientific experiment – In an experiment you have controls – to measure the result vs a comparison point.  One of the most fundamental accounting rules for GAAP (Generally Accepted Accounting Principles) is that GAAP is consistently applied- so you have a control in place and can do valid comparisons between quarters, years and months, just like a good trial or experiment.

These financial statements are the gold mine of information that stock analysts use to figure out how much these companies are worth, and what their stock price should be.

While stock analysts also look at other data outside of these basic financial statements, even if you only had the data in these statements, you’d have a strong understanding of the company’s past performance and current state. And from there, with some insight into the market that the company operates in, you can start to make some predictions about the future.

In the next part, we’ll explore the income statement. We’ll go through the structure of it, then we’ll look at some real world examples.

Stay tuned! (Which is easier if you join my mailing list to be updated when the next installment comes out.)

Stylized illustration of a scientist looking through financial documents and reports

How to learn the financial basics about a new (to you) business

Before we start exploring financial statements, let’s start with the basics on where to find information about a life sciences company with which we’re unfamiliar.

Let’s take the example of Bio-Techne Corporation.

Maybe you’re already familiar with Bio-Techne Corporation. Maybe not. Either way I bet you will learn something from digging through their financial statements.

Our first step is to go to the Electronic Data Gathering, Analysis and Retrieval (EDGAR) tool from the US Securities and Exchange Commission (SEC):

https://www.sec.gov/edgar/searchedgar/companysearch

You can type “Bio-Techne” in the “Company and Person Lookup” field. As you type, automatic suggestions will be displayed below the search field. Once you see Bio-Techne, click that suggestion. If you simply click the gray “search” button on the right, you will be taken to a much broader page of search results instead of the page specifically for Bio-Techne.

Alternatively, you can search Google for “Bio-Techne stock”, find that its stock ticker is “TECH”, and put “TECH” in the “Company and Person Lookup” field instead.

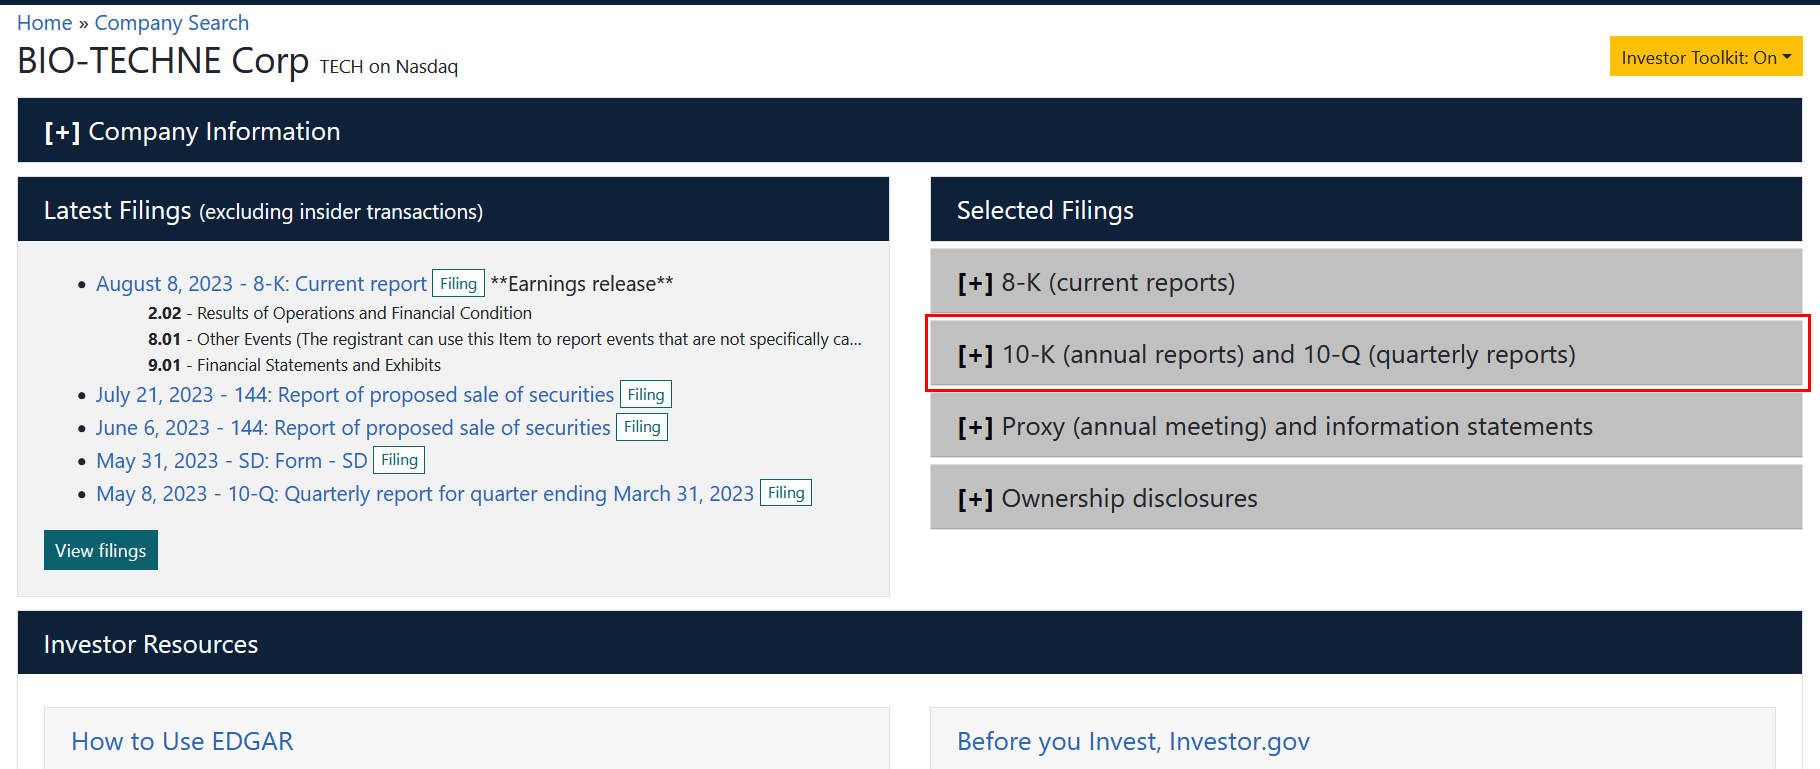
On the right, you’ll see “10-K (annual reports) and 10-Q (quarterly reports)”, click the “+” sign, then open the most recent 10-K, which was filed on August 24, 2022.

Screenshot of the EDGAR listing for Bio-Techne, with the 10-K and 10-Q section highlighted

Look for the 10-K and 10-Q section on the right

10-K Overview

You’ll see a table of contents, where you can click on “Item 1. Business”. The very first section there is titled “Overview”

Here’s a summarized version of what we find

  • Bio-Techne Corporation is a global life sciences company that provides products and services for research and clinical diagnostics.
  • The company operates in two segments: Protein Sciences and Diagnostics & Genomics.
  • The Protein Sciences segment offers proteins, antibodies, immunoassays, cell and gene therapy solutions, and instruments for biotechnology and pharmaceutical customers.
  • The Diagnostics and Genomics segment offers molecular diagnostic products, cytogenetics media, and clinical controls for clinical laboratories and hospitals.

Fantastic!

Even after this little bit of reading, we have a good sense of what Bio-Techne Corporation does. It’s a products and services company in protein sciences and diagnostics/genomics. In other words, they provide reagents and instrumentation to researchers for both research and diagnostic test development and deployment.

Business Risk Factors

Now let’s move to “Item 1A. Risk Factors”.

This is where management lists the risks to business success.

Even beyond risk management, it gives us a good understanding of how the business runs.

For example, Bio-Techne lists 6 fairly generic categories of risk, with each section having more detailed risks listed:

  1. Economic and Industry Risks
  2. Acquisition and Investment Risks
  3. Strategic and Operational Risks
  4. Intellectual Property Risks
  5. Financial and Tax Risks
  6. Legal, Regulatory, Compliance and Reputational Risks

These are my learnings from the risk factors (see if you agree or have others to add):

  • There are a good number of risks related to supply chain and manufacturing concerns: getting raw materials, forecasting and scaling manufacturing appropriately, being able to get finished goods to customers.
    • Many of these risks were realized during the pandemic, and you can see this reflected in the numerous references to COVID-19 throughout the risk section.
    • Most of these risks would impact any business in this space to a large extent.
  • There are also a good number of risks around operating in the highly regulated healthcare space, which are shared with other players in the industry.
    • One particularly interesting note here is the privacy and security regulatory risk due to the acquisition of a diagnostics company, “a risk that has been elevated with the acquisition of Exosome Diagnostics, whose laboratory testing service is a healthcare provider that obtains and uses protected health information.”
    • i.e., they didn’t use to be directly in the diagnostics services business and now they are and it carries a different level of risk.
  • You can also tell that this business is fueled by innovation through references to risks around hiring and retaining highly skilled workers and protecting intellectual property.
    • Risks may not be uniformly shared across the healthcare sector, but these are fairly standard fare for the life sciences.
  • You can also see specific financial risks related to Bio-Techne, in particular around their Credit Agreement that bears interest at a variable rate and the fact that they are subject to risk from exchange rates due to their international presence.

Even if you’re familiar with a business, it’s worth going back through “Item 1. Business” and “Item 1A. Risk Factors” in its most recent annual report.

Start here, and you’ll have a foundation for the analytical work to come. Along the way, we’ll also dig into what some of the financial terms in the risk factors mean and how they impact the business. To keep up with this series, consider joining my mailing list to be updated when the next installment comes out.

Illustration of a scientist explaining business finance concepts

Why am I writing about finance?

Many scientists and engineers I’ve worked with have expressed frustration at not being able to have the kind of influence they want over the strategic directions of the companies in which they work. Oftentimes they feel their perspectives are being dismissed, particularly in discussions with colleagues in other functions.

But in the wise words of a mentor of mine, ‘if you want business people to listen to you, you have to be able to speak in a language they will understand.’ That language is, by and large, the language of finance. If you can frame the opportunities you see in language that your non-scientific colleagues can easily understand (and then explain to the board of directors), your ideas are much more likely to gain traction.

Similarly, scientific leaders will be better equipped to identify and prioritize scientific programs and investments if they can connect the dots between technical advancements and the ever-important bottom line (which, it turns out, refers to an actual line in the income statement!).

So my hope is that when armed with a little better financial intelligence, scientists and engineers can start to bridge the gap between the technical aspects of our business and the business end of the business.

Of course, I myself am one of these scientists. And so a big part of why I am writing this series is to force myself to dig deeper into some of the learnings I have gleaned from books, podcasts, and articles along the way (including frantically looking up terms like GAAP and EBIDTA during earnings calls and executive meetings). By virtue of my scientific background, hopefully the language I use throughout this series will be a little less opaque and a little more understandable for those of us who are more likely to be reading Nature articles than the Economist.

Specifically, in this mini-series, we will cover:

  • Some basics on financial statements
  • The big three financial statements (and their component parts):
    • the income statement
    • the balance sheet
    • the cash flow statement
  • Key ratios or evaluating the financial health of a business
  • Numbers investors care about and why
  • How to understand whether a new project/investment has (financial) merit through Net Present Value

To start, a couple references and an important acknowledgement. My initial foray into the wonderful world of finance was inspired by my friend Jeff Krimmel’s frequent LinkedIn posts on business and strategy in the energy sector. Jeff and I met as PhD students at Caltech, and I have been awed by his seamless transition from hardcore engineering to business and strategy, and am always impressed by his insightful discourse. I highly recommend checking out Jeff on LinkedIn and perusing his mini-course on Energy Finance. You’ll notice that this course closely mimics his course in places (with his blessing).

Another important source here is the book, Financial Intelligence. A Manager’s Guide to Knowing What the Numbers Really Mean, by Karen Berman and Joe Knight. It’s a great read and has many details that I won’t cover in this series.

In any case, I hope you enjoy! I would love to hear your questions, thoughts, and comments along the journey. And if you are really keen, join my mailing list so you don’t miss the future installments of this series.

Powered by WordPress & Theme by Anders Norén